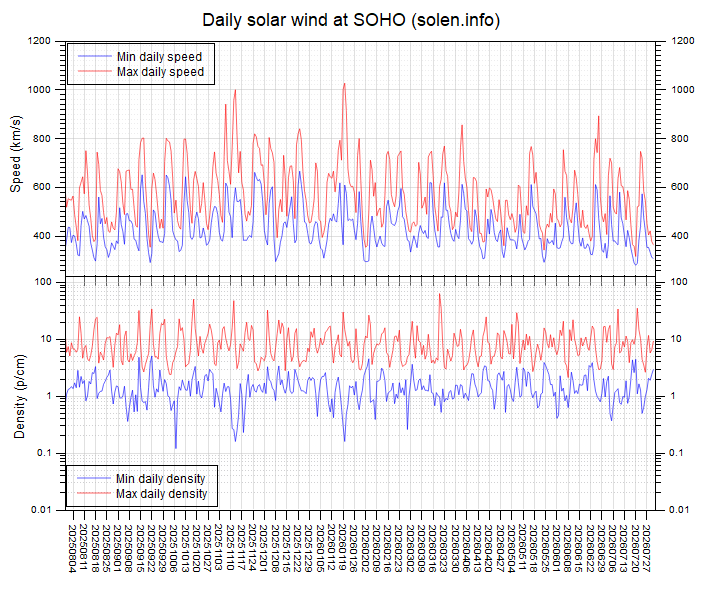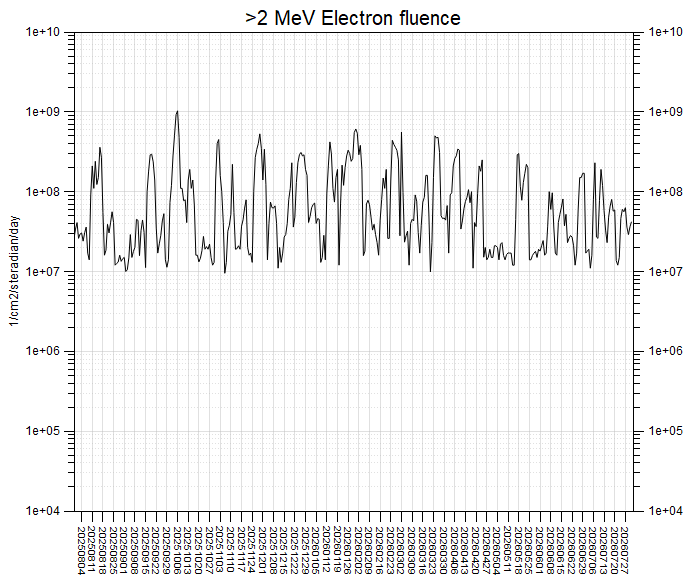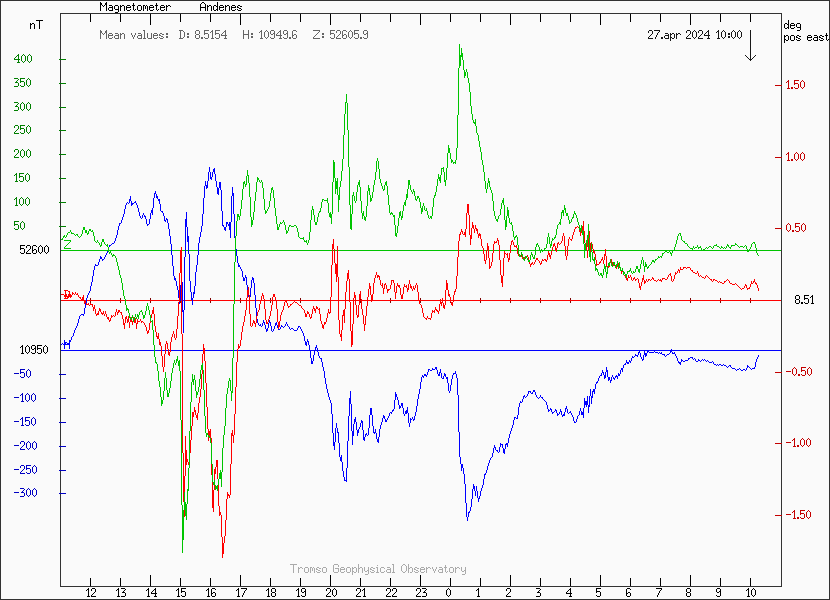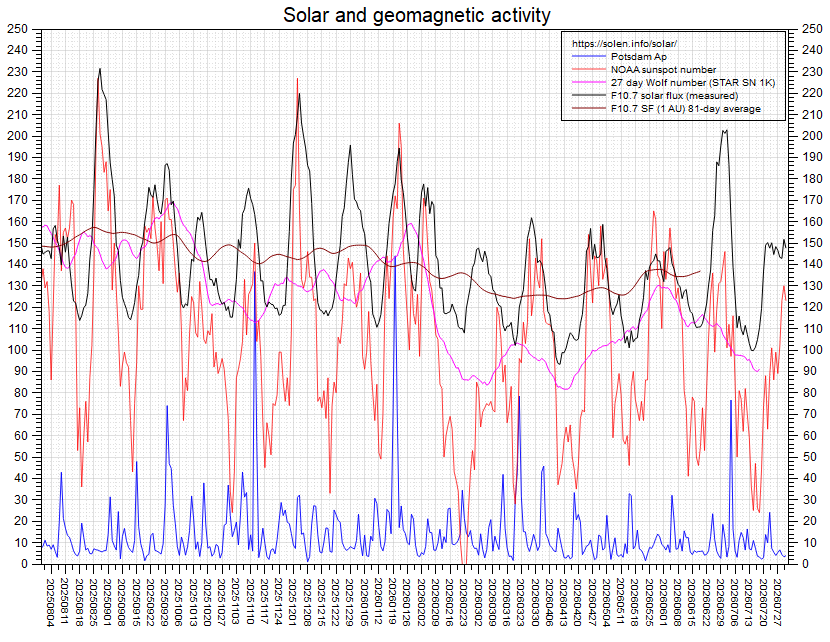
The geomagnetic field was at very quiet levels. Solar wind speed at SOHO ranged between 312 and 377 km/sec, averaging 351 km/sec (-21 km/sec compared to the previous day). The high latitude magnetometer at Andenes was at quiet levels. The above 10 MeV proton flux was at background levels until 17:25 UT when protons associated with the M1 long duration event in AR 14492 began arriving. The above 10 MeV flux peaked at 18.1 pfu at 20:55 UT and has since then decreased slowly.
Solar flux density measured at 20h UT on 2.8 GHz was 151.7 - decreasing 35.0 over the previous solar rotation. The background x-ray flux was flare enhanced after 15:30 UT and didn't return to pre flare levels until early on July 31.
The 365 day average solar flux at 1 AU was 140.35 (183 days ago). The 81 day average solar flux at 1 AU was 136.5 (41 days ago, this is 42.7% of the total SC25 solar flux range from the max 81 day average peak on September 4, 2024 at 227.3 and an average 81 day flux of 69 at solar minimum). SC25 365d peak: 195.9 on October 13, 2024.
The Potsdam WDC planetary A index was 3 (STAR Ap - based on the average of three hour interval ap indices: 3.4). Three hour interval K indices: 11011111 (planetary), 10132421 (Boulder), 20011200 (Andenes).
The background x-ray flux is at the class C1 level (GOES 19).
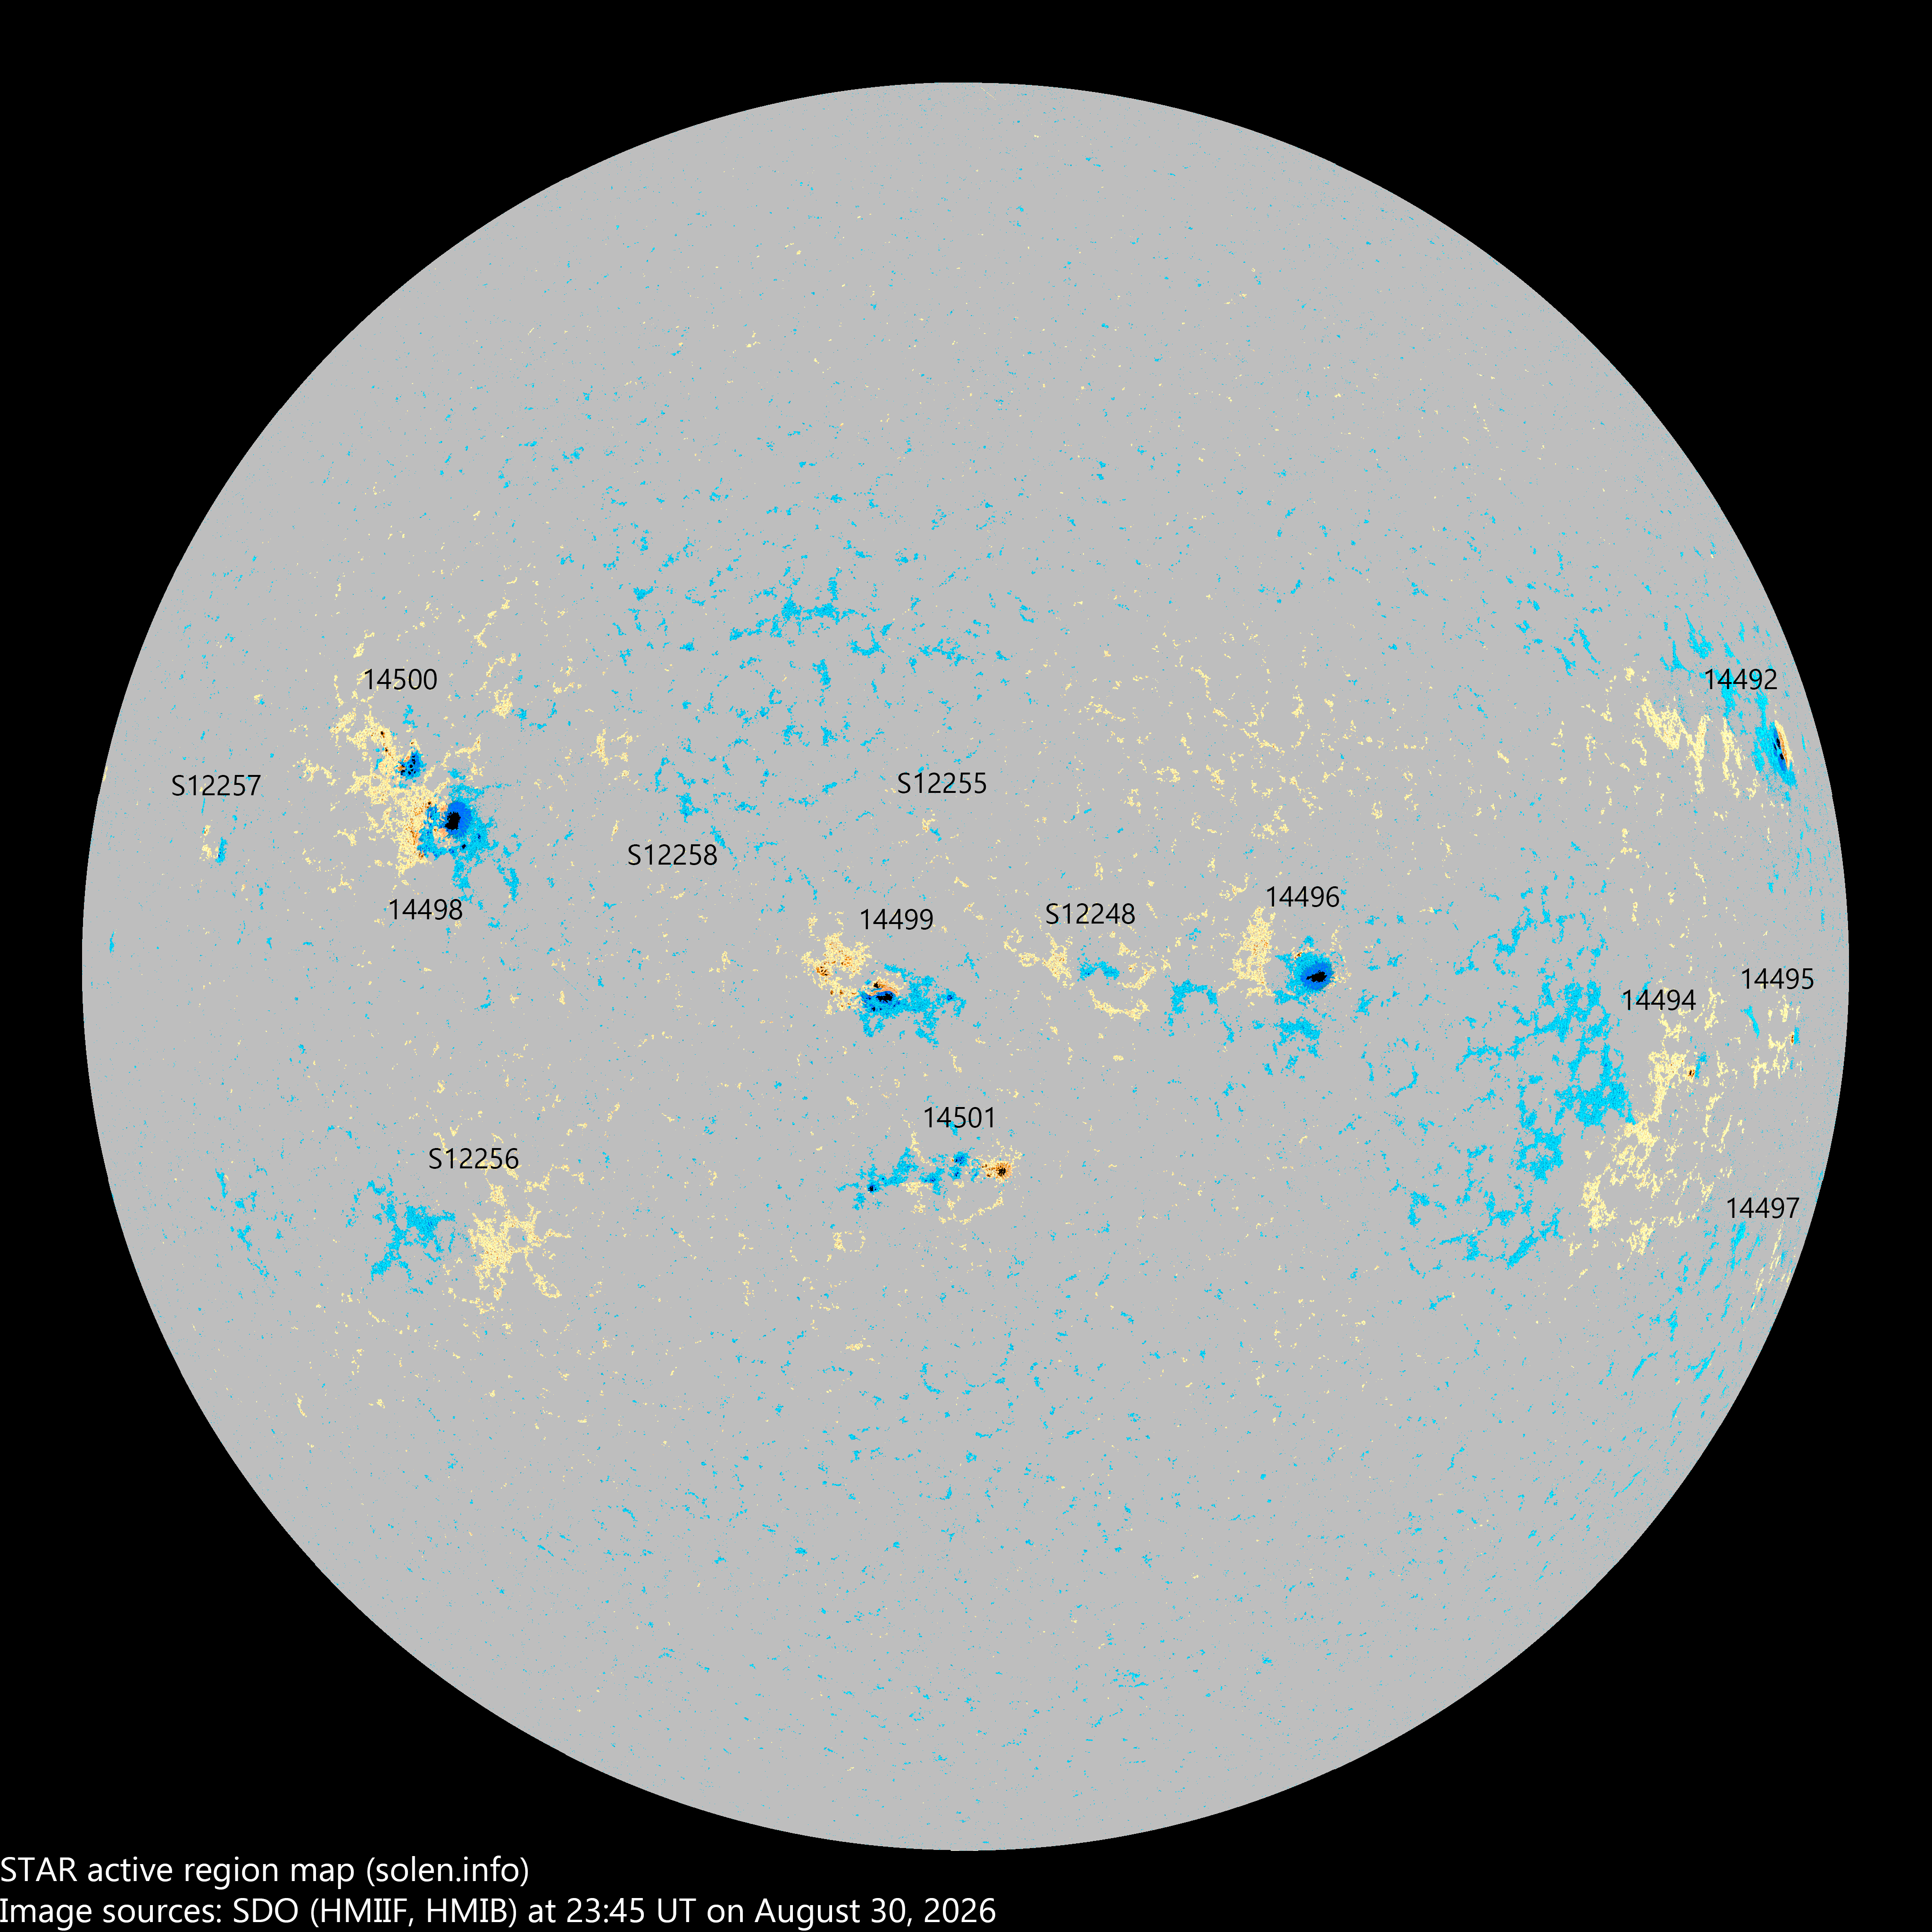
At the time of counting spots (see image time), spots were observed in 14 active regions using 2K resolution (SN: 266) and in 12 active regions using 1K resolution (SN: 183) SDO/HMI images.
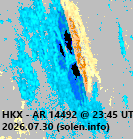
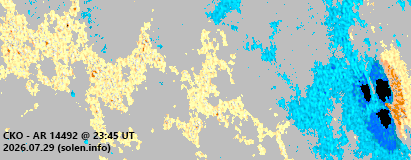
AR 14492 [N16W73] was mostly unchanged and
produced an M1.9 very long duration proton event peaking at 16:58 UT.
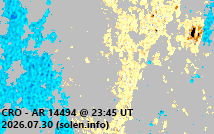
AR 14494 [S03W54] decayed slowly and quietly.
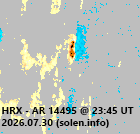
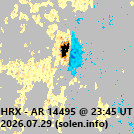
AR 14495 [S02W69] decayed slowly and quietly.
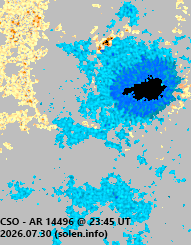
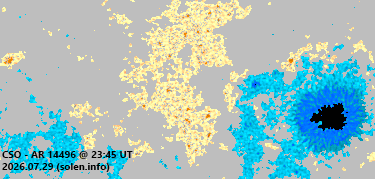
AR 14496 [N05W23] decayed slowly and quietly.
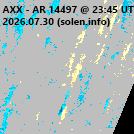
AR 14497 [S21W73] decayed slowly and quietly.
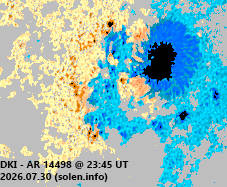
AR 14498 [N14E37] decayed slowly and lost the
magnetic delta configuration. There is still polarity intermixing and an M
flare is possible. Due to the approach of AR 14500 the two regions could
start interacting.
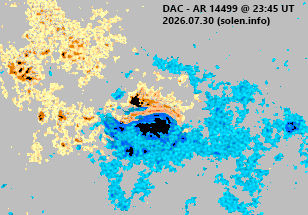
AR 14499 [N04E06] developed further gaining a magnetic delta
configuration. A minor M flare is possible.
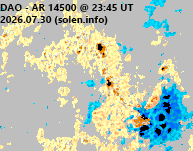
AR 14500 [N17E41] gained spots and area in the leading spot section
as the region began to approach AR 14498.
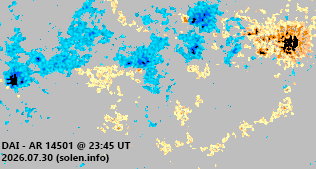
AR 14501 [S08W01] lost complexity and matured.
Spotted regions not observed (or interpreted
differently) by SWPC/USAF:
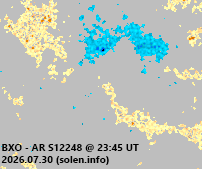
AR S12448 [N05W07] was quiet and stable.
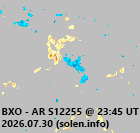
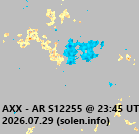
AR S12255 [N14E02] was quiet and stable.
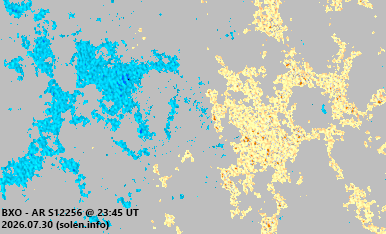
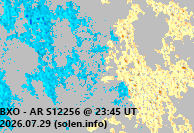
AR S12256 [S13E36] was quiet and stable.
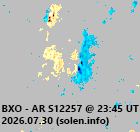
New AR S12257 [N10E59] emerged with tiny spots.
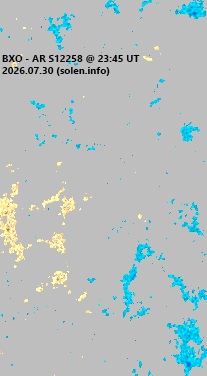
New AR S12258 [N19E20] was observed with tiny spots in an old plage
area.
C1 flares not attributed to an AR due to missing imagery: C1.0 @ 01:40, C1.1 @ 02:15, C1.0 @ 02:32, C1.1 @ 04:41, C1.1 @ 07:36, C1.2 @ 07:43, C1.0 @ 13:20 UT
C2+ flares
| Magnitude | Peak time (UT) | Location | Source | Recorded by | Comment |
| C3.8 | 06:06 | N18E48 | 14498 | GOES18 | |
| M1.9 | 16:58 | 14492 | GOES18 | LDE, CME, proton event moderate type II radio sweep |
|
| C2.4 | 20:56 | GOES18 | |||
| C2.4 | 22:21 | GOES18 |
July 28-29: No obviously Earth directed CMEs were observed in
available coronagraph imagery.
July 30: A full halo CME was observed after the M1.9 LDE in AR 14492.
The CME could reach Earth on August 2.
[Coronal
hole history (since October 2002)]
[Compare today's report to the situation one solar rotation ago:
28 days ago
27 days ago
26 days ago]
A positive polarity coronal hole (CH1388), an extension of the southern polar coronal hole was Earth facing on July 27-28. There's a chance of geomagnetic effects on July 31.
The geomagnetic field is expected to be at quiet to unsettled levels on July 30-31 due to effects from CH1388. Quiet levels are likely on August 1-2.
| Coronal holes (1) | Coronal mass ejections (2) | M and X class flares (3) |
1) Effects from a coronal hole could
reach Earth within the next 5 days. When the high speed stream has arrived
the color changes to green.
2) Effects from a CME are likely to be observed at Earth within 96 hours.
3) There is a possibility of either M or X class flares within the next 48 hours.
Green: 0-30% probability, Yellow: 30-70% probability, Red: 70-100% probability.
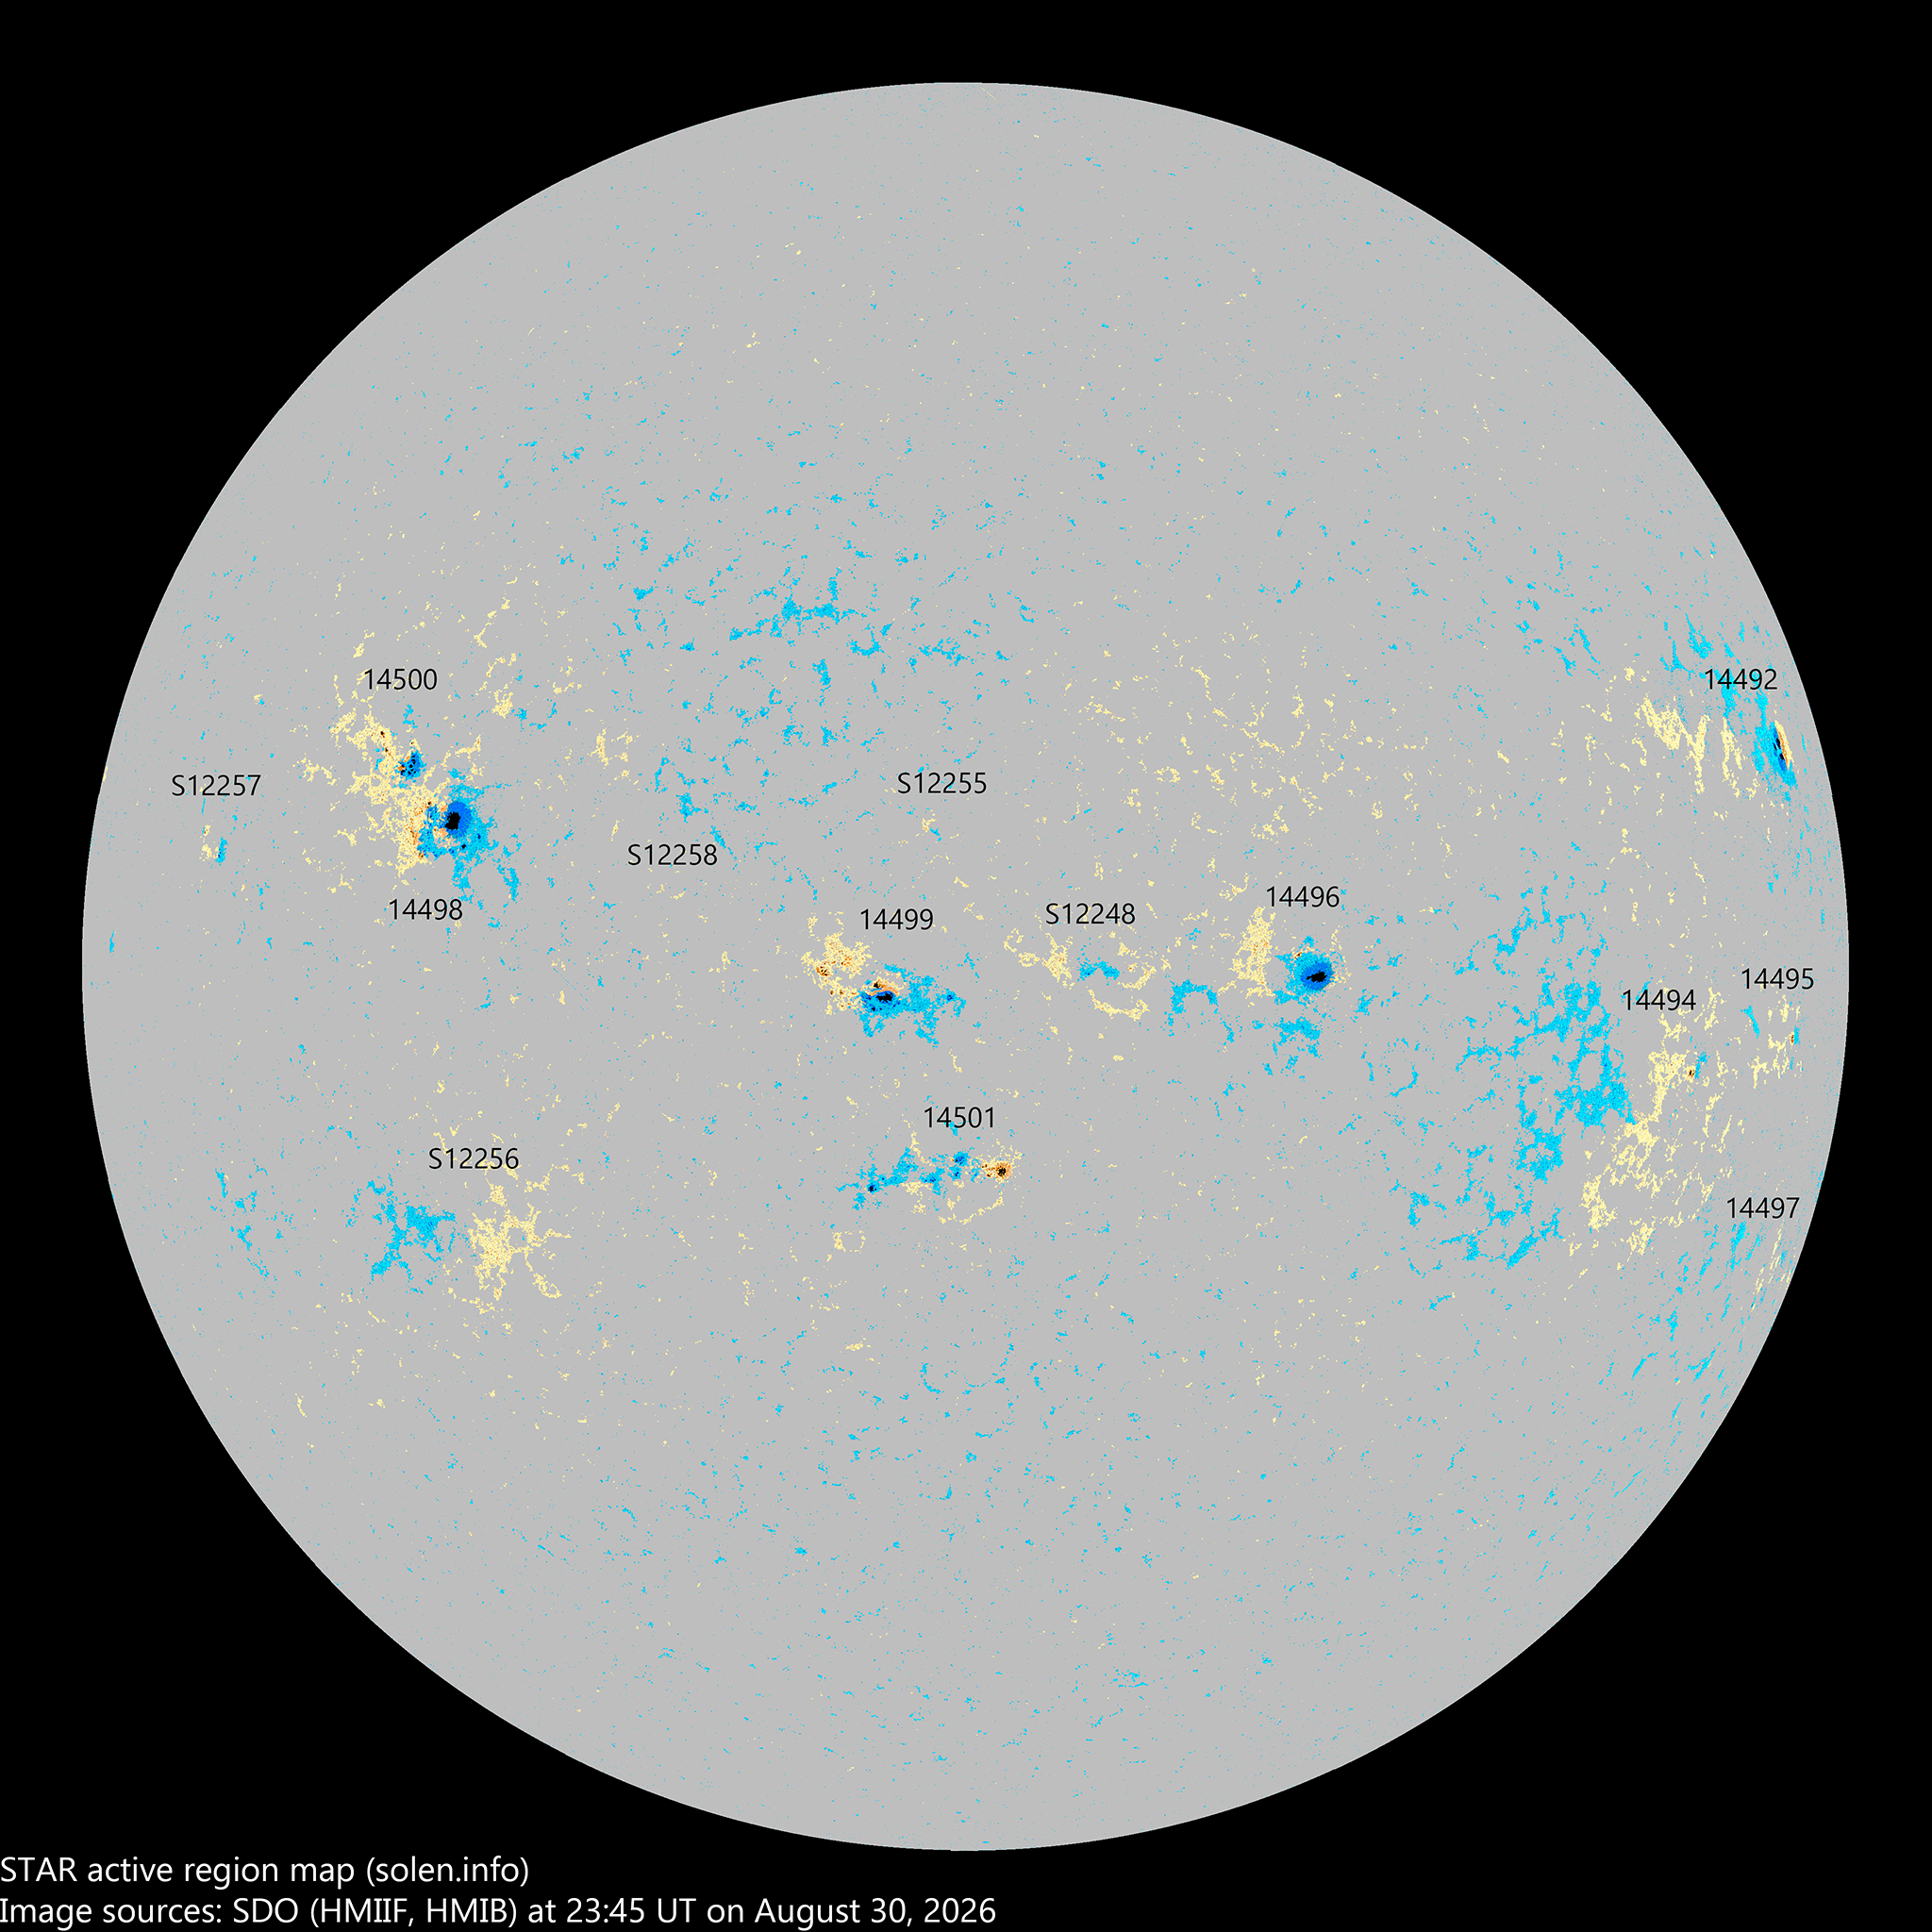
(Click on image for 2K resolution).
4K resolution.
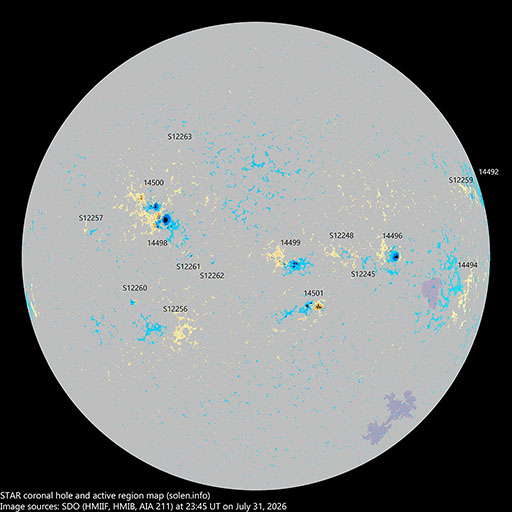
Compare to the previous day's image. 0.5K image
When available the active region map has a coronal hole polarity overlay where red (pink) is negative and blue is positive.
Data for all officially numbered solar regions according to the Solar Region Summary provided by NOAA/SWPC, all other regions are numbered sequentially as they emerge using the STAR spot number. Comments are my own, as is the STAR spot count (spots observed at or inside a few hours before midnight) and data for regions not numbered by SWPC or where SWPC has observed no spots. SWPC active region numbers in the table below and in the active region map above are the historic SWPC/USAF numbers. SWPC data considered to be not sufficiently precise (location, area, classification) are colored red.
| Active region | SWPC date numbered STAR detected |
Spot count | Location at midnight | Area | Classification | SDO / HMI 4K continuum image with magnetic polarity overlays |
Comment | ||||
|---|---|---|---|---|---|---|---|---|---|---|---|
| SWPC/ USAF |
STAR | SWPC | STAR | Current | Previous | ||||||
| 2K | 1K | ||||||||||
| 14492 | 2026.07.18 2026.07.19 |
3 | 3 | 3 | N16W74 | 0100 | HSX | HKX |
 |
 |
was AR S12227 area: 0270 location: N16W73 |
| 14497 | 2026.07.20 2026.07.26 |
1 | S21W74 | 0002 | AXX |
 |
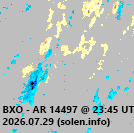 |
was AR S12230 location: S21W73 |
|||
| 14494 | 2026.07.20 2026.07.21 |
2 | 5 | 1 | S04W55 | 0020 | HSX | CRO |
 |
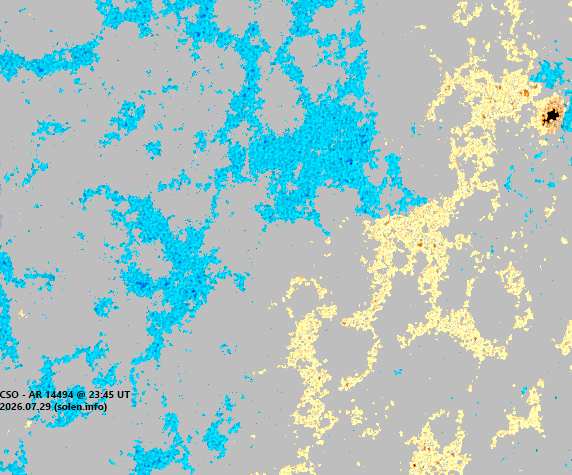 |
was AR S12231 location: S03W54 |
| 14495 | 2026.07.22 2026.07.23 |
1 | 2 | 2 | S03W69 | 0010 | AXX | HRX |
 |
 |
was AR S12241 location: S02W69 |
| 14496 | 2026.07.22 2026.07.23 |
3 | 6 | 3 | N05W23 | 0100 | HSX | CSO |
 |
 |
was AR S12242 area: 0150 |
| S12245 | 2026.07.24 | N03W13 | |||||||||
| S12246 | 2026.07.25 | S23W38 | |||||||||
| S12247 | 2026.07.25 | N18W36 | |||||||||
| S12248 | 2026.07.26 | 6 | 2 | N05W07 | 0005 | BXO |
 |
 |
|||
| 14498 | 2026.07.27 2026.07.27 |
12 | 28 | 12 | N14E37 | 0130 | CAI | DKI |
 |
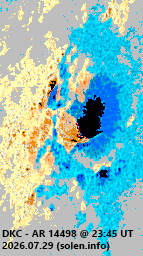 |
beta-gamma was AR S12449 area: 0300 |
| 14499 | 2026.07.27 2026.07.28 |
15 | 28 | 19 | N04E05 | 0060 | DAO | DAC |
 |
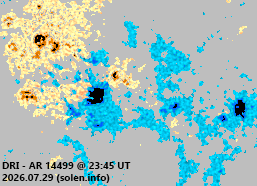 |
beta-delta was AR S12250 area: 0130 location: N04E06 |
| S12251 | 2026.07.27 | N07W38 |
 |
||||||||
| 14500 | 2026.07.28 2026.07.29 |
6 | 14 | 8 | N18E44 | 0020 | CAO | DAO |
 |
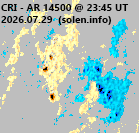 |
was AR S12252 area: 0100 location: N17E41 |
| 14501 | 2026.07.28 2026.07.29 |
8 | 20 | 10 | S08E03 | 0020 | DSO | DAI |
 |
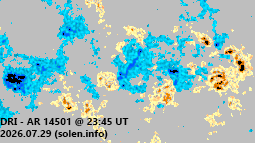 |
beta-gamma was AR S12253 area: 0080 location: S08W01 |
| S12254 | 2026.07.28 | N21E34 |
 |
||||||||
| S12255 | 2026.07.28 | 2 | N14E02 | 0002 | BXO |
 |
 |
||||
| S12256 | 2026.07.29 | 4 | 1 | S13E36 | 0006 | BXO |
 |
 |
|||
| S12257 | 2026.07.30 | 4 | 1 | N10E54 | 0007 | BXO |
 |
||||
| S12258 | 2026.07.30 | 3 | 1 | N19E20 | 0005 | BXO |
 |
||||
| Total spot count: | 50 | 126 | 63 | ||||||||
| Sunspot number: | 130 | 266 | 183 | (total spot count + 10 * number of spotted regions) | |||||||
| Weighted SN: | 85 | 172 | 109 | (Sum of total spot count + classification weighting for each AR. Classification weighting: X=0, R=3, A/S=5, H/K=10) | |||||||
| Relative sunspot number (Wolf number): | 143 | 146 | 146 | ||||||||
| Month | Average solar flux | International sunspot number (WDC-SILSO) |
Smoothed sunspot number (4) | Average
ap (3) |
|
|---|---|---|---|---|---|
| Measured | 1 AU | ||||
| 2024.05 | 187.7 | 191.9 | 172.1 | 149.1 (+4.6) | 23.56 (SC25 peak) |
| 2024.08 | 246.1 (SC25 peak) |
252.2 | 216.0 (SC25 peak) | 156.8 (+1.8) | 15.96 |
| 2024.10 | 221.0 | 219.6 | 165.8 | 160.9 (+1.5) (SC25 solar max) | 18.99 |
| 2025.04 | 162.5 | 163.6 | 141.4 | 133.3 (-2.6) | 17.62 |
| 2025.05 | 135.3 | 138.3 | 78.5 | 128.6 (-4.7) | 17.26 |
| 2025.06 | 131.3 | 135.4 | 114.6 | 124.7 (-3.9) | 21.43 |
| 2025.07 | 137.8 | 142.3 | 125.9 | 122.5 (-2.2) | 11.80 |
| 2025.08 | 154.9 | 158.7 | 133.7 | 118.4 (-4.1) | 9.97 |
| 2025.09 | 154.4 | 156.0 | 129.7 | 113.1 (-5.3) | 14.02 |
| 2025.10 | 139.5 | 138.6 | 114.6 | 108.5 (-4.6) | 15.64 |
| 2025.11 | 140.3 | 137.3 | 91.7 | 106.9 (-1.6) | 21.01 |
| 2025.12 | 160.8 | 155.8 | 124.0 | 107.0 (-0.1) | 13.35 |
| 2026.01 | 148.7 | 144.0 | 115.0 | (104.4 projected, -2.6) | 22.47 |
| 2026.02 | 136.4 | 133.1 | 77.4 | (100.0 projected, -4.4) | 12.88 |
| 2026.03 | 131.0 | 129.7 | 86.6 | (94.7 projected, -5.3) | 15.44 |
| 2026.04 | 120.0 | 120.9 | 79.3 | (90.8 projected, -3.9) | 12.10 |
| 2026.05 | 125.4 | 128.2 | 101.4 | (89.5 projected, -1.3) | 9.80 |
| 2026.06 | 137.9 | 142.2 | 94.3 | (87.4 projected, -2.1) | 9.57 |
| 2026.07 | 134.2 (1) | 76.9 (2A) / 79.4 (2B) / 97.2 (2C) Average ISN to date: 85.5 At this level the SSN for January 2026 would become: 104.5 |
(82.9 projected, -4.5) | (10.5) | |
| 2026.08 | (80.7 projected, -2.2) | ||||
| 2026.09 | (79.8 projected, -0.9) | ||||
| 2026.10 | (77.7 projected, -2.1) | ||||
| 2026.11 | (74.9 projected, -2.8) | ||||
| 2026.12 | (71.7 projected, -3.2) | ||||
1) Running average based on the daily 20:00 UTC observed solar flux value
at 2800 MHz and any corrections applied to that measurement.
2A) Current impact on the monthly sunspot number based on the Boulder
(NOAA/SWPC) sunspot number (accumulated daily sunspots / month days).
2B) Boulder SN current month average to date.
2C) STAR SDO 1K Wolf number 27 day average.
3) Running average based on the quicklook and definitive Potsdam WDC ap
indices. Values in red
are based on the definitive international
GFZ Potsdam WDC ap
indices.
4) Source: WDC-SILSO, Royal Observatory
Of Belgium, Brussels
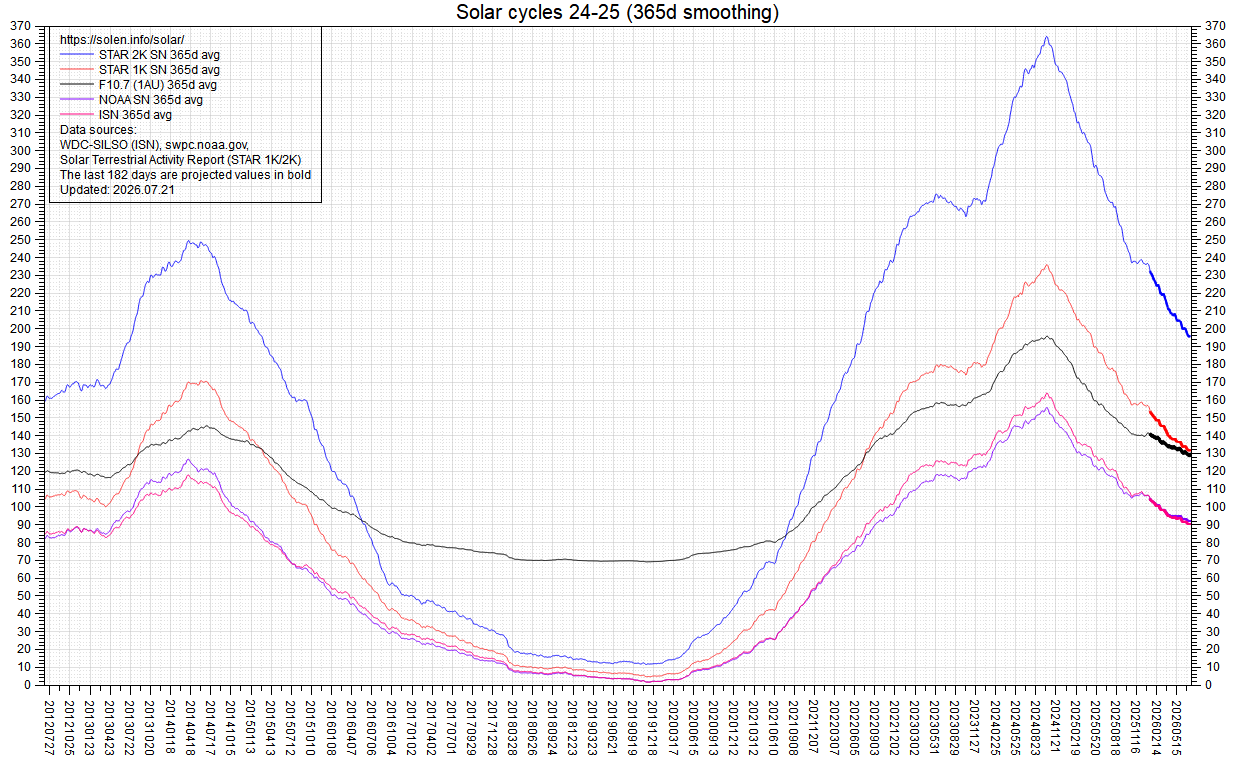
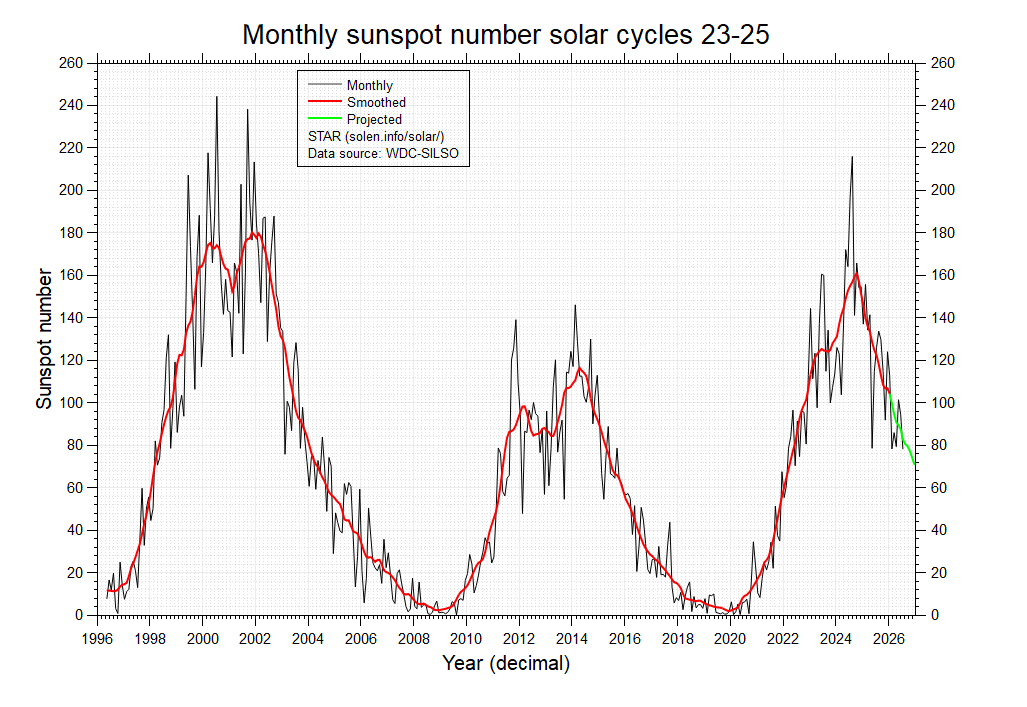
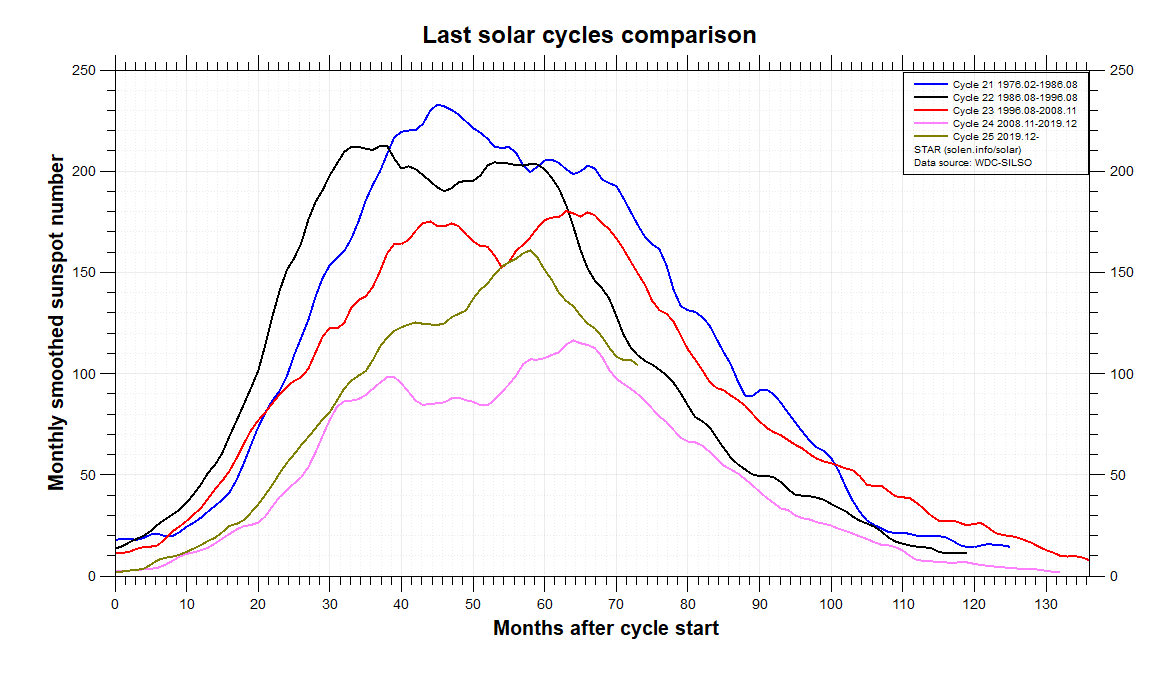
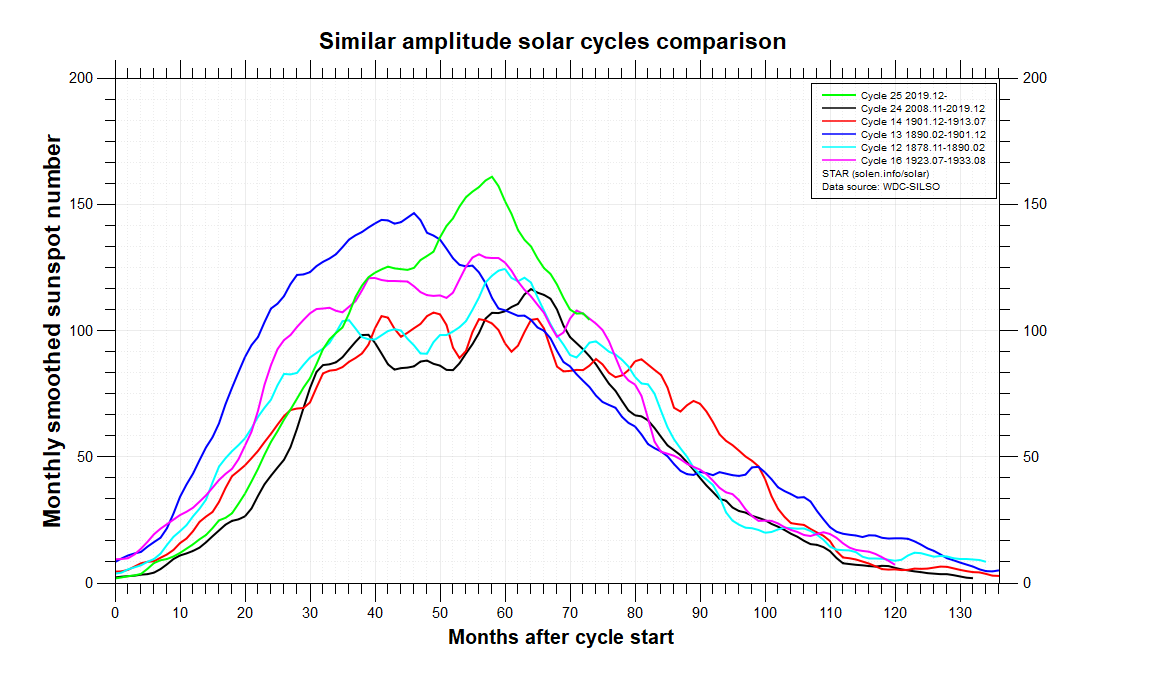
Solar activity appears to have exited the solar max phase as of February
2026 with a strong decrease in the number of sunspots observed. The northern
polar field has weakened considerably over the last months, and although
there is a chance the the field could recover over the next 1-2 years, there
is an increasing chance that solar cycle 26 will be very weak. The southern
polar field is not impressive either, however, a southern polar coronal hole
has formed early in 2026 and appears to be growing.
All 365 day smoothed sunspot numbers reached a maximum on October 11-12, 2024.
This became the peak of SC25 (365 day smoothed peaks: STAR 1K: 236.1, STAR 2K: 364.3, NOAA SN: 156.0, ISN: 163.9),
while the 365d
smoothed solar flux peaked on October 13, 2024, just 1.7% below the SC23
peak, and 62.6% above the SC24 peak.
--------------------------------------------------------------------------------------
This report has been prepared by Jan Alvestad. It is based on the analysis of data from whichever sources are available at the time the report is prepared. All time references are to Universal Time. Comments and suggestions are always welcome.
SDO images are courtesy of NASA/SDO and the AIA, EVE, and HMI science teams.