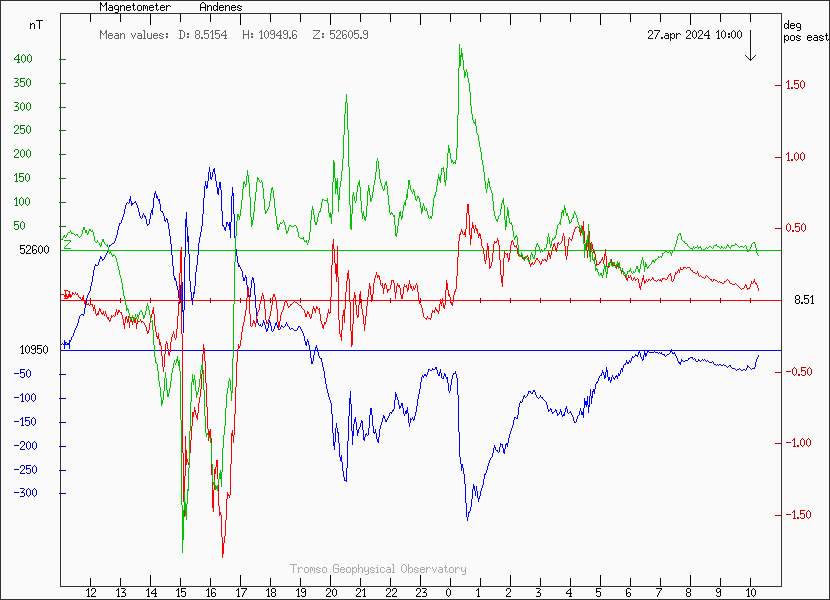
The geomagnetic field was at quiet to active levels on November 24 under the influence of weak effects from CH1257. Solar wind speed at SOHO ranged between 397 and 468 km/sec, averaging 427 km/sec (+16 compared to the previous day). The high latitude magnetometer at Andenes recorded quiet to minor storm levels. The above 10 MeV proton flux was at background levels all day.
Solar flux density measured at 20h UT on 2.8 GHz was 202.7 - decreasing 52.8 over the previous solar rotation. (Centered 1 year average SF at 1 AU - 183 days ago: 186.10. In comparison SC24 peaked on June 28, 2014 at 145.50 while SC23 peaked on February 23, 2002 at 198.15. Current SC25 peak: 186.14 on May 21, 2024). The Potsdam WDC planetary A index was 7 (STAR Ap - based on the mean of three hour interval ap indices: 7.4). Three hour interval K indices: 22200124 (planetary), 12202323 (Boulder), 23200115 (Andenes).
The background x-ray flux is at the class C3 level (GOES 16).
At the time of counting spots (see image time), spots were observed in 14 active regions using 2K resolution (SN: 362) and in 13 active regions using 1K resolution (SN: 246) SDO/HMI images.
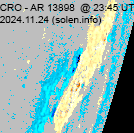
AR 13898 [S16W77] decayed slowly and quietly.
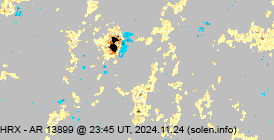
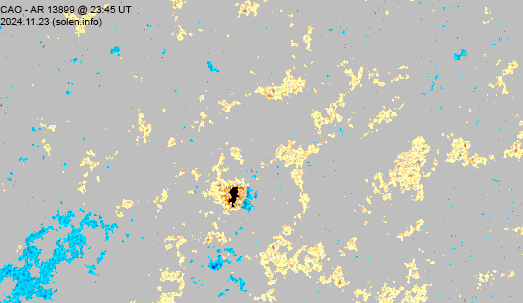
AR 13899 [S11W40] decayed slowly and quietly.
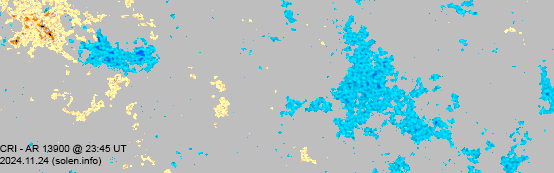
AR 13900 [N25W04] developed in the trailing spot section and decayed
in the leading spot section. SWPC split off the trailing spot section into
AR 13909.
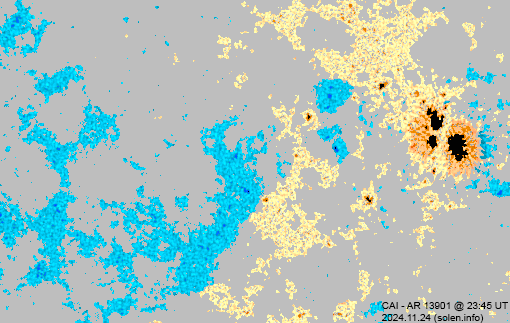
AR 13901 [S07W18] decayed in the leading spot section while a few new
spots emerged in the trailing spot section.
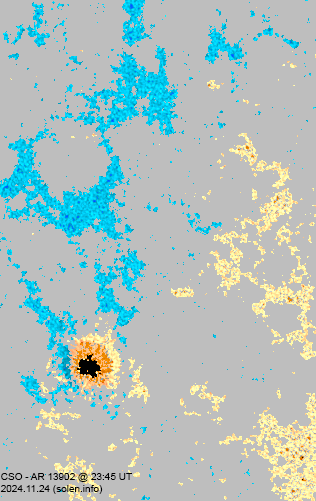
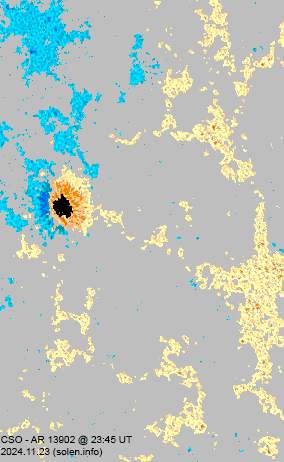
AR 13902 [S16E23] was quiet and stable.
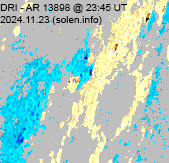
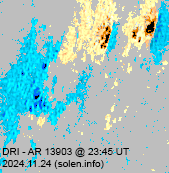
AR 13903 [S11W61] decayed slowly and quietly.
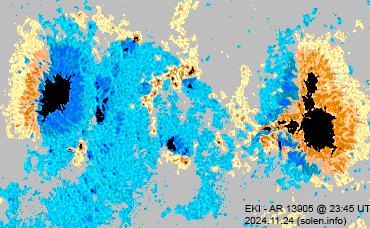
AR 13905 [S09E38] developed several small magnetic delta
configurations in the intermediate spot section. A major flare is possible.
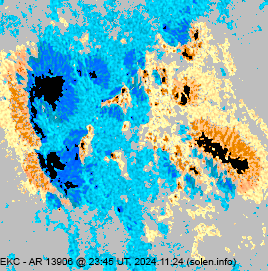
AR 13906 [S16E48] has a magnetic delta configuration within a
penumbra in the southeastern part of the spot group. A major flare is possible.
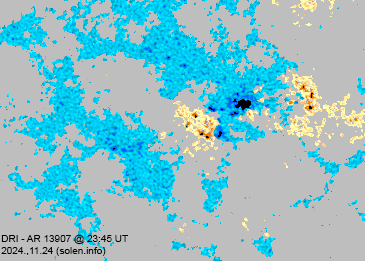
AR 13907 [S21E04] has polarity intermixing and may be capable of
producing a minor M class flare.
AR 13908 [N14E66] decayed slowly and produced several flares.
Spotted regions not observed (or interpreted
differently) by SWPC/USAF:
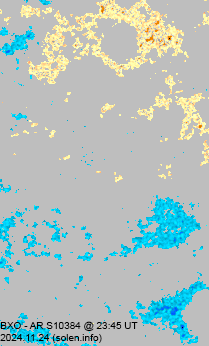
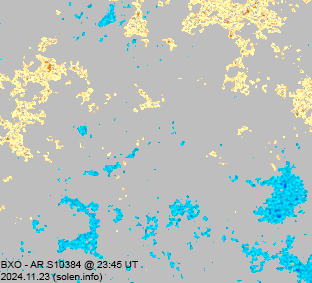
S10384 [S18W12] was quiet and stable.
S10396 [N01W10] was quiet and stable.
S10397 [N14E44] reemerged with tiny spots
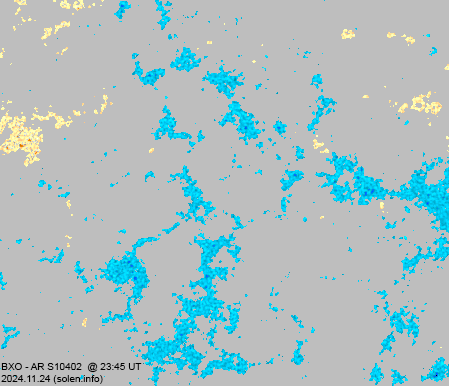
New region S10402 [N24E07] was observed with tiny spots in an old
plage area.
A large filament eruption in the southern hemisphere was observed after 02h UT on November 25. A partial halo CME was associated with this event.
C2+ flares
| Magnitude | Peak time (UT) | Location | Source | Recorded by | Comment |
| C5.4 | 00:52 | 13906 | GOES16 | ||
| C7.6 | 01:08 | 13906 | GOES16 | ||
| C4.6 | 01:15 | behind northeast limb | GOES16 | ||
| C2.5 | 02:47 | behind southwest limb | GOES16 | ||
| C2.5 | 03:01 | 13908 | GOES16 | ||
| C3.9 | 03:28 | 13908 | GOES16 | ||
| C5.6 | 03:36 | 13906 | GOES16 | ||
| C5.6 | 06:33 | 13906 | GOES16 | ||
| C5.5 | 07:53 | S17E52 | 13906 | GOES16 | |
| C5.7 | 10:19 | 13908 | GOES16 | ||
| C5.7 | 10:44 | 13908 | GOES16 | ||
| C4.9 | 11:19 | behind northeast limb | GOES16 | ||
| C6.0 | 11:39 | 13906 | GOES16 | ||
| C3.9 | 13:00 | 13906 | GOES16 | ||
| C5.6 | 13:12 | N12E75 | 13908 | GOES16 | |
| C4.5 | 15:17 | behind northeast limb | GOES16 | ||
| C6.6 | 16:31 | S15E52 | 13906 | GOES16 | |
| C2.8 | 17:29 | 13906 | GOES16 | ||
| C2.7 | 17:57 | 13906 | GOES16 | ||
| C2.9 | 18:33 | 13906 | GOES16 | ||
| M1.1 | 20:22 | N21E90 | GOES16 | ||
| C4.2 | 20:53 | 13906 | GOES16 | ||
| C2.8 | 22:!5 | behind northeast limb | GOES16 |
November 22-24: No obviously Earth directed CMEs were observed.
[Coronal
hole history (since October 2002)]
[Compare today's report to the situation one solar rotation ago:
28 days ago
27 days ago
26 days ago]
A recurrent negative polarity southern hemisphere coronal hole (CH1257) was Earth facing on November 19-20. A recurrent positive polarity northern hemisphere coronal hole (CH1258) will likely rotate across the central meridian on November 27.
Long distance low and medium frequency (below 2 MHz) propagation along paths north of due west over upper middle and high latitudes is poor to fair. Propagation on long distance northeast-southwest paths is poor to fair.
The geomagnetic field is expected to be quiet to unsettled on November 25 due to effects from CH1257 and quiet on November 26-27.
| Coronal holes (1) | Coronal mass ejections (2) | M and X class flares (3) |
1) Effects from a coronal hole could
reach Earth within the next 5 days. When the high speed stream has arrived
the color changes to green.
2) Effects from a CME are likely to be observed at Earth within 96
hours.
3) There is a possibility of either M or X class flares within the
next 48 hours.
Green: 0-30% probability, Yellow: 30-70% probability, Red: 70-100% probability.
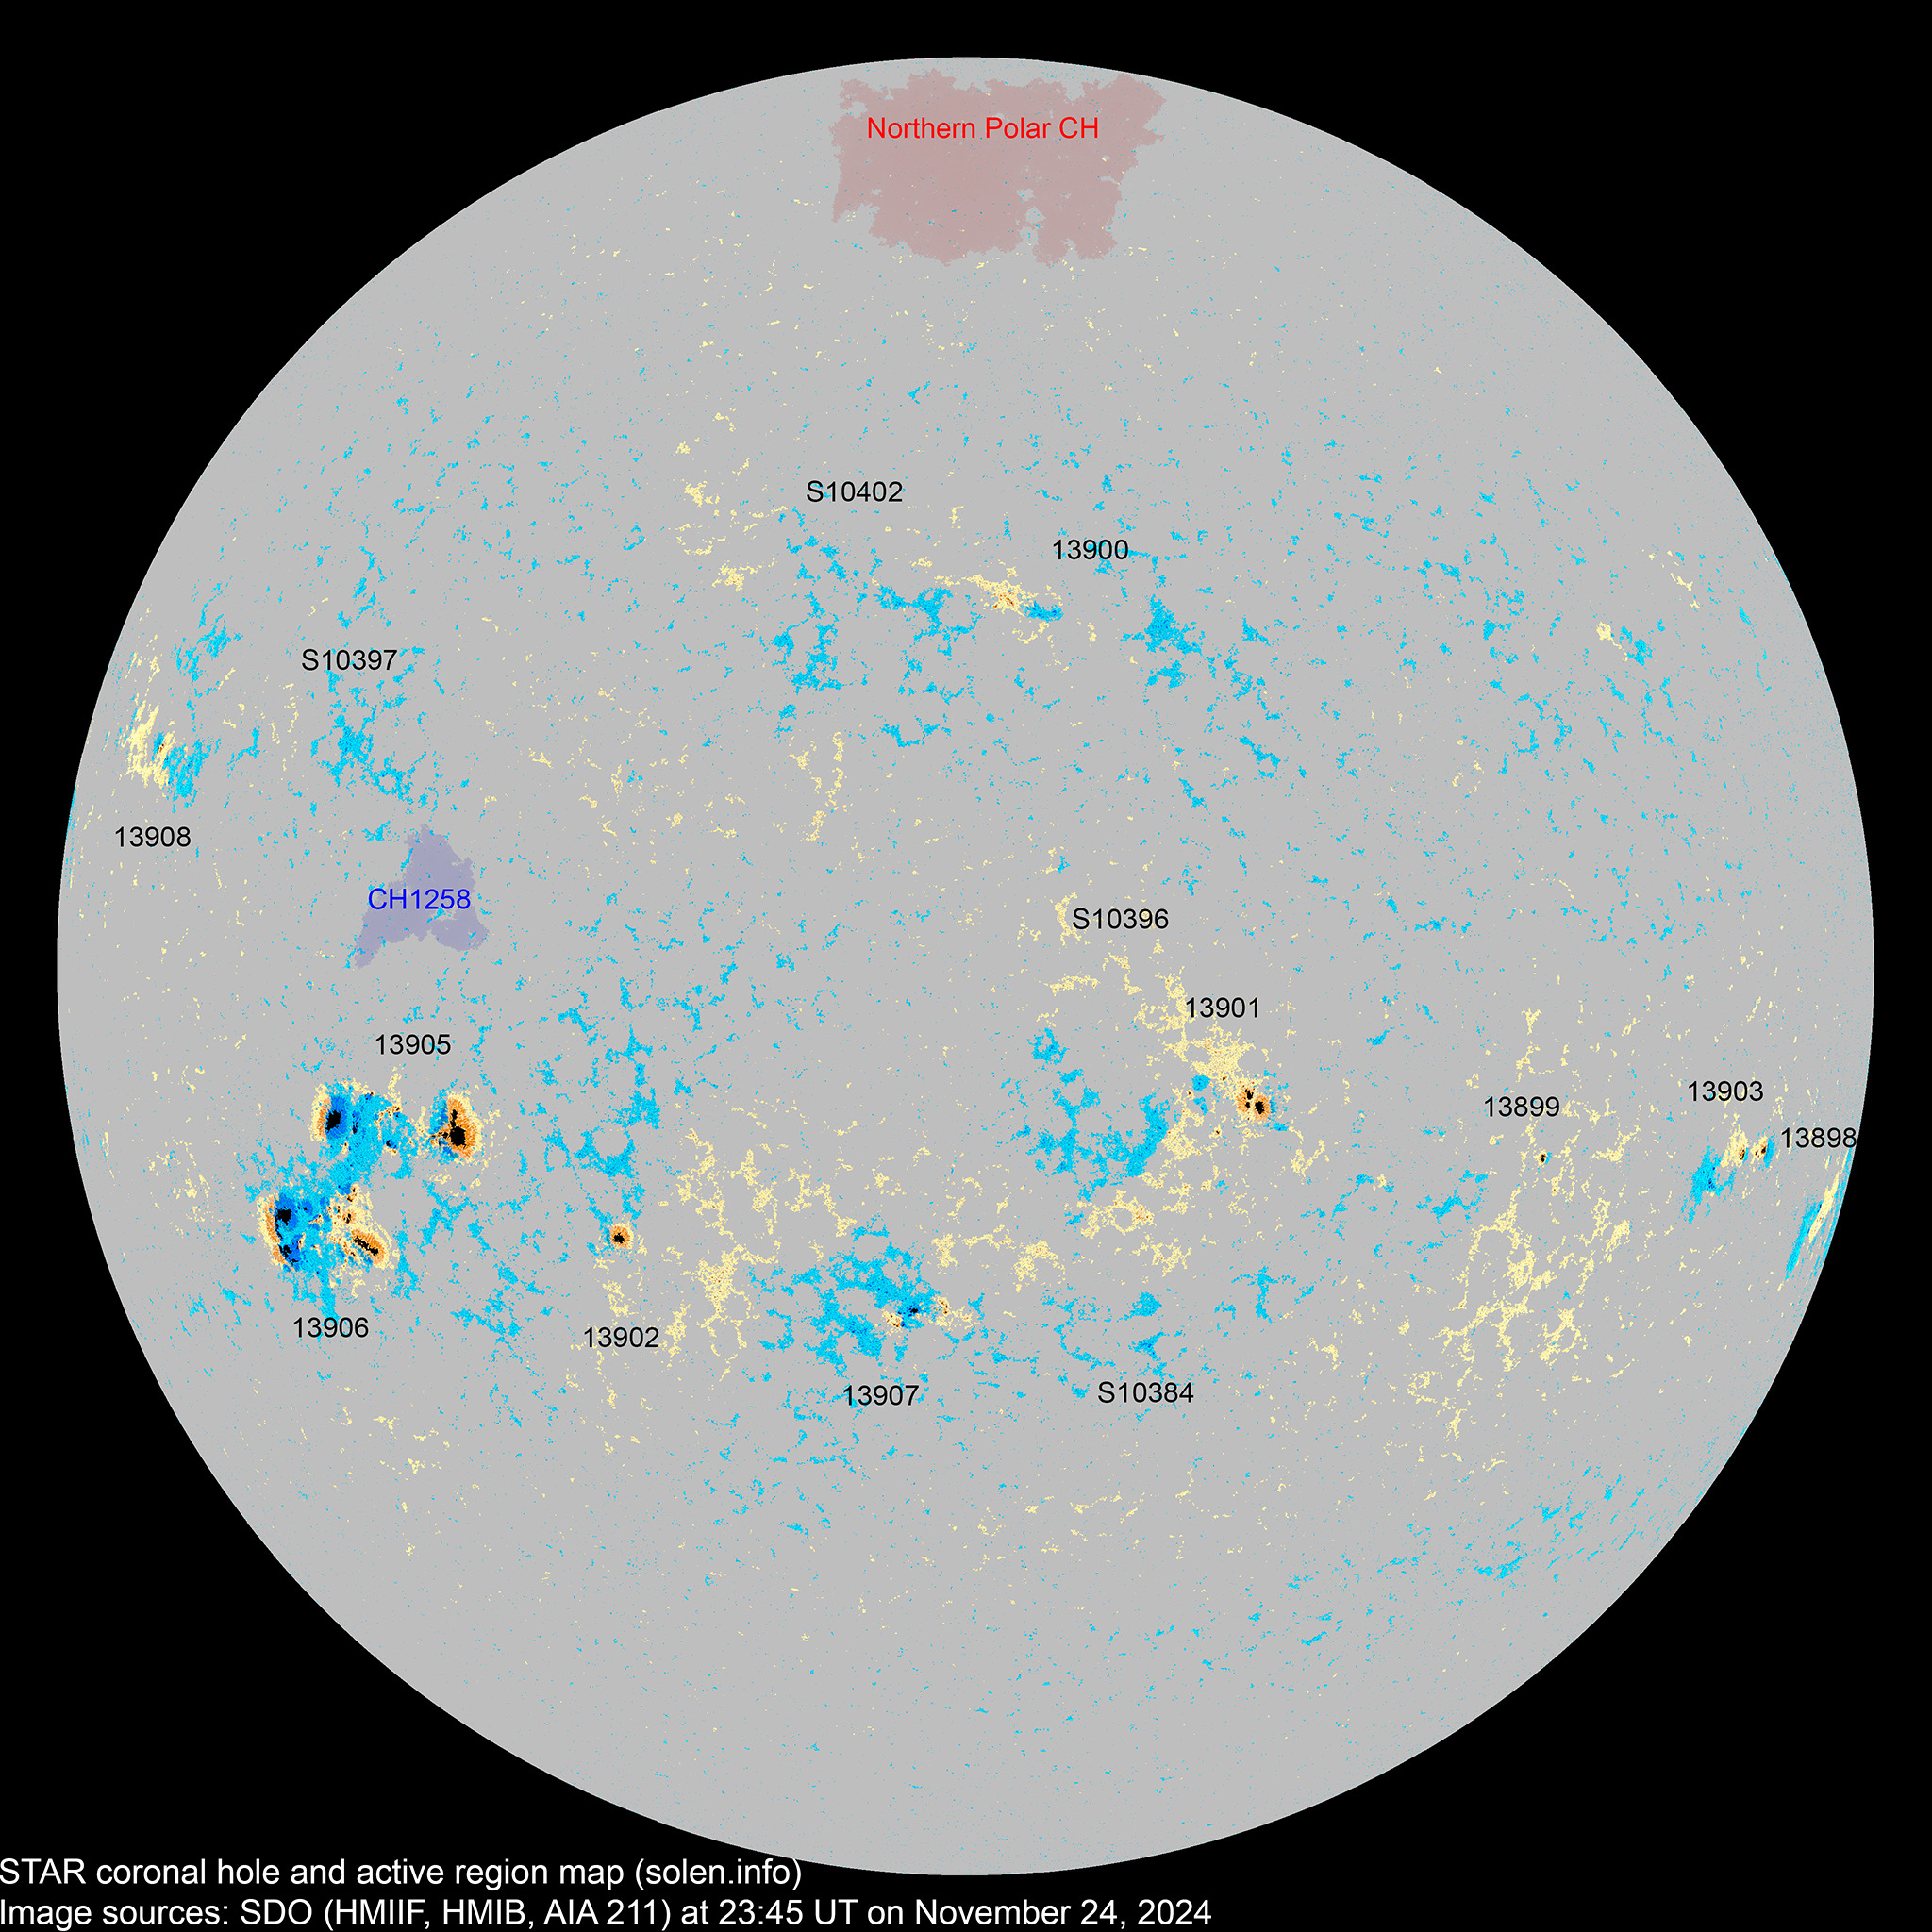
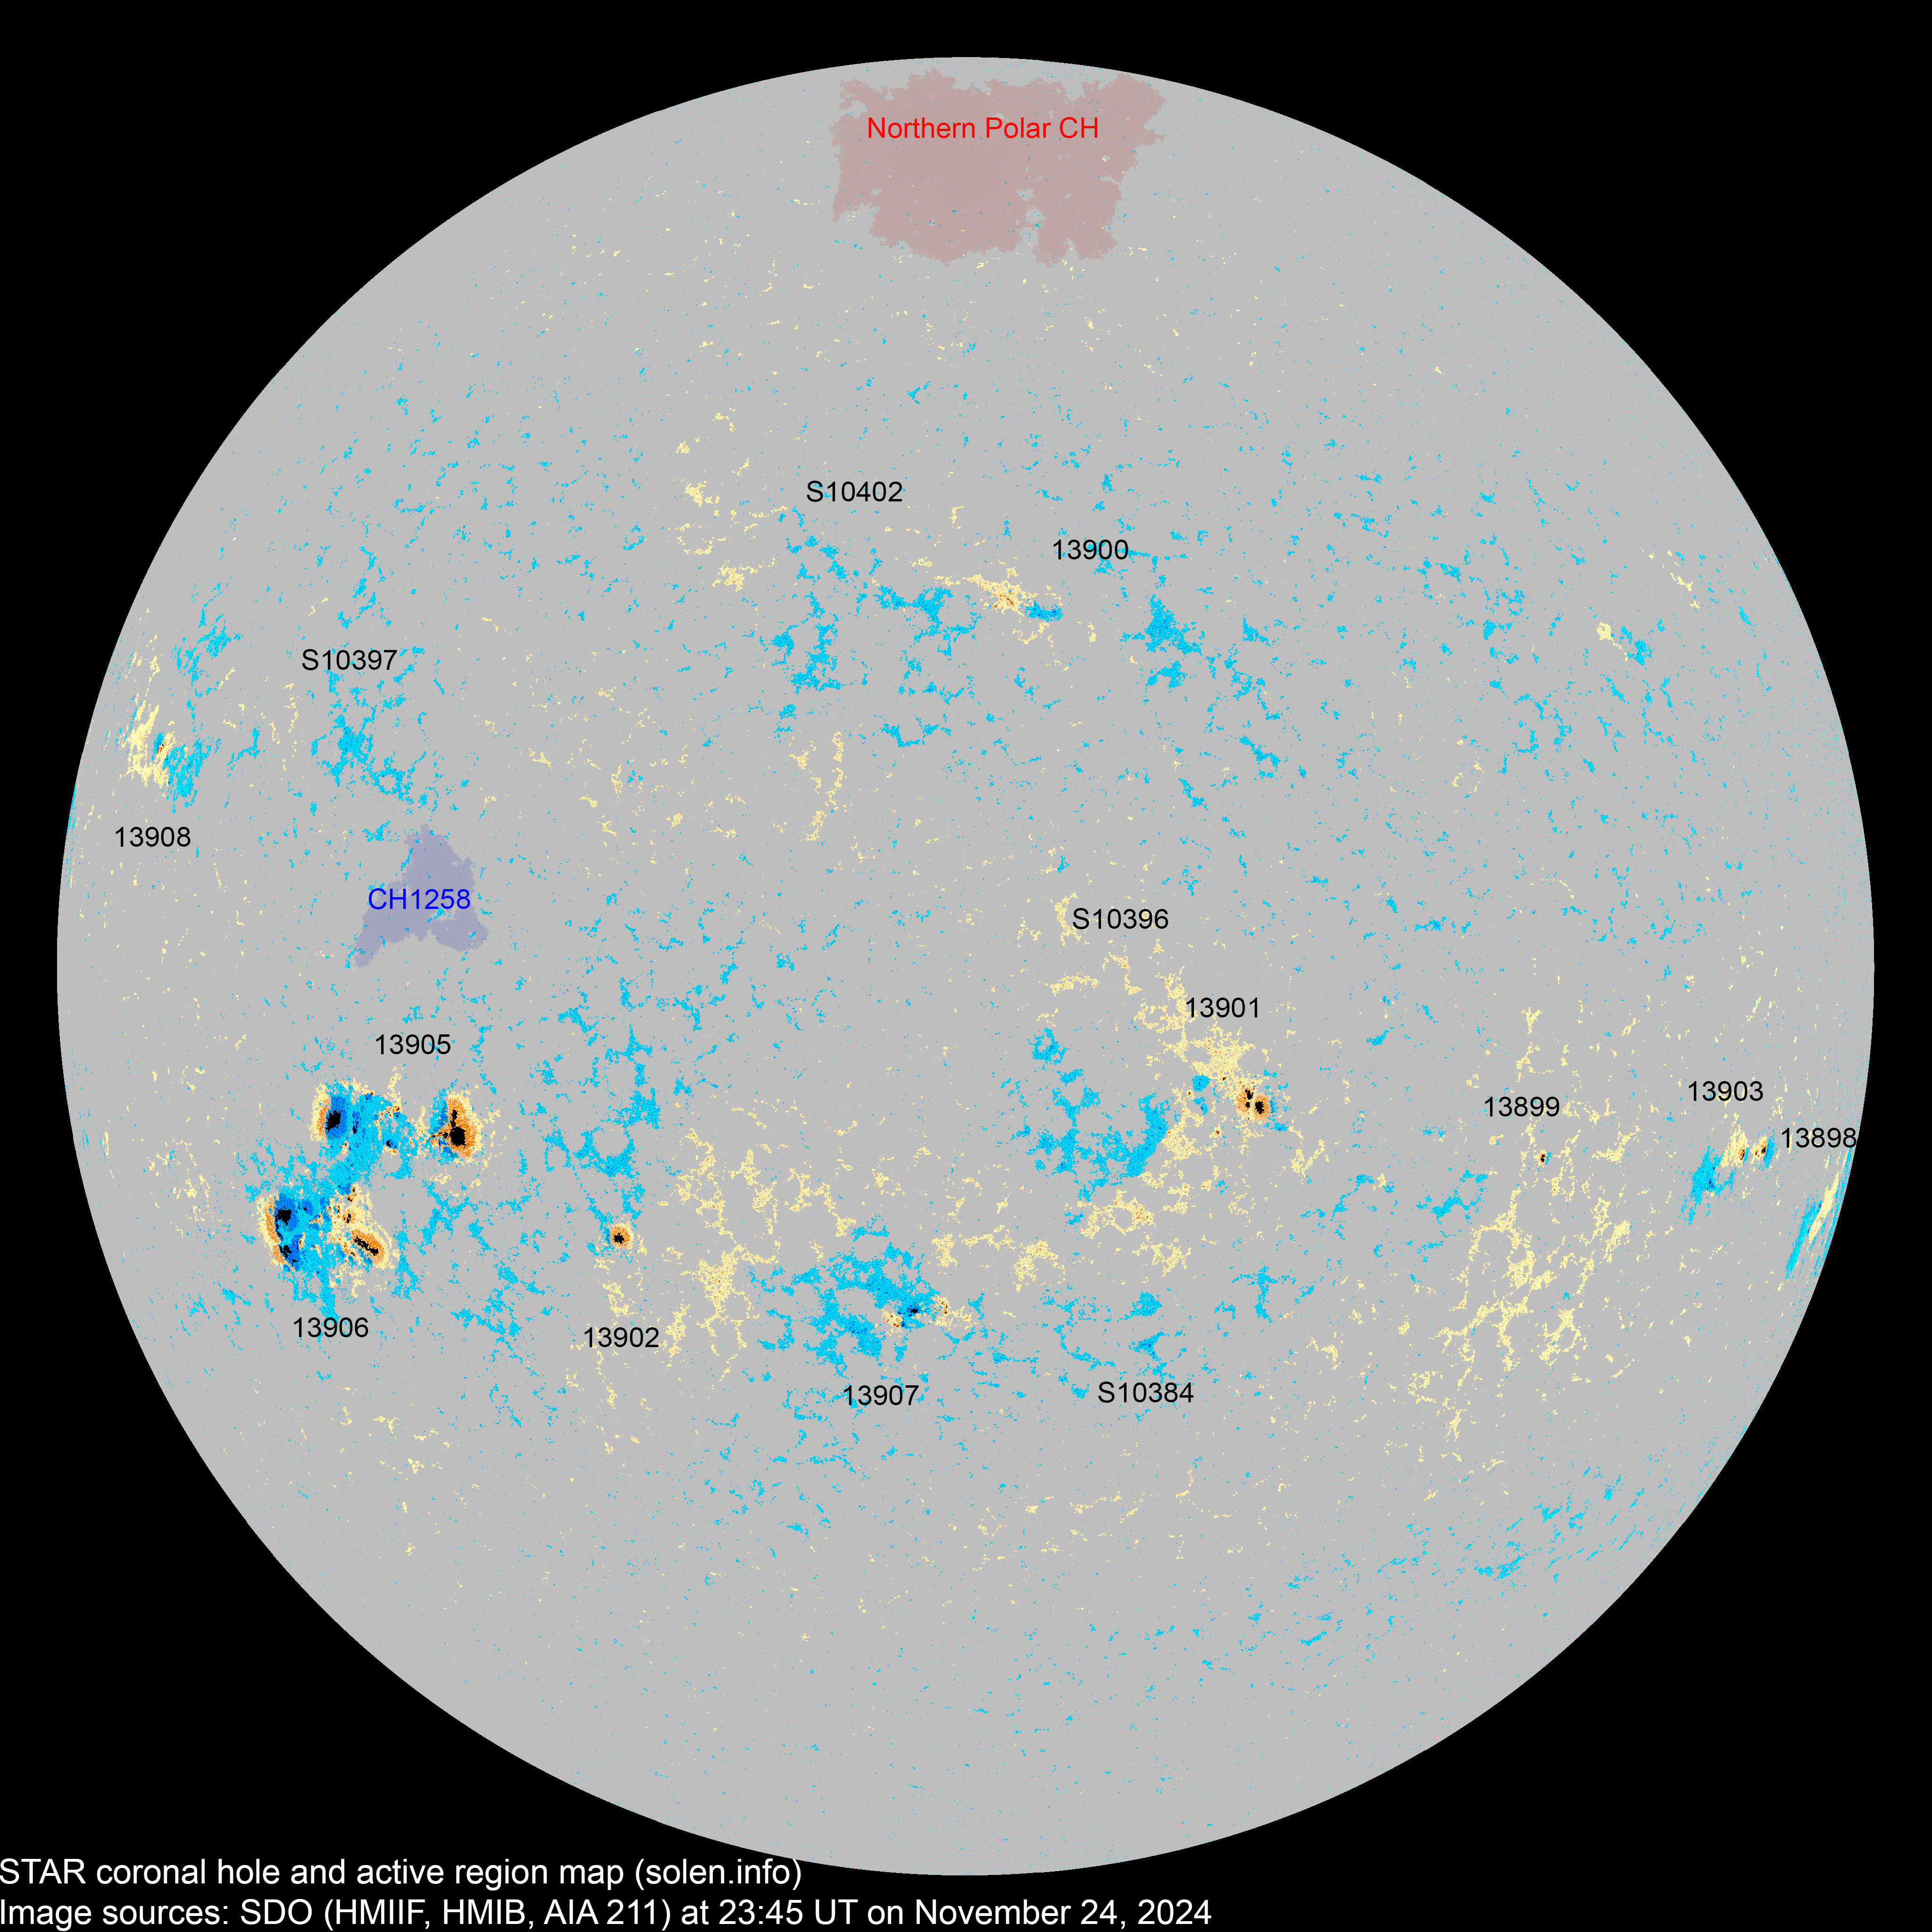
(Click on image for 2K resolution).
4K resolution.
Compare to the previous
day's image. 0.5K image
When available the active region map has a coronal hole polarity overlay where red (pink) is negative and blue is positive.
Data for all officially numbered solar regions according to the Solar Region Summary provided by NOAA/SWPC, all other regions are numbered sequentially as they emerge using the STAR spot number. Comments are my own, as is the STAR spot count (spots observed at or inside a few hours before midnight) and data for regions not numbered by SWPC or where SWPC has observed no spots. SWPC active region numbers in the table below and in the active region map above are the historic SWPC/USAF numbers. SWPC data considered to be not sufficiently precise (location, area, classification) are colored red.
| Active region | SWPC date numbered STAR detected |
Spot count | Location at midnight | Area | Classification | SDO / HMI 4K continuum image with magnetic polarity overlays |
Comment | ||||
|---|---|---|---|---|---|---|---|---|---|---|---|
| SWPC/ USAF |
Magnetic (SDO) |
SWPC | STAR | Current | Previous | ||||||
| 2K | 1K | ||||||||||
| 13893 | 2024.11.12 2024.11.13 |
S19W88 |
 |
location: S19W81 |
|||||||
| 13900 | 2024.11.16 2024.11.18 |
17 | 8 | N22W22 | 0040 | CRI |
 |
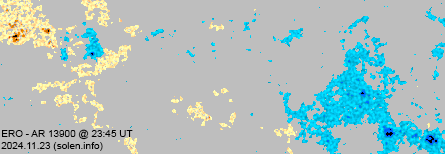 |
location: N25W04 SWPC split off the trailing spot section into AR 13909 |
||
| 13901 | 2024.11.17 2024.11.18 |
10 | 29 | 17 | S07W16 | 0090 | CAO | CAI |
 |
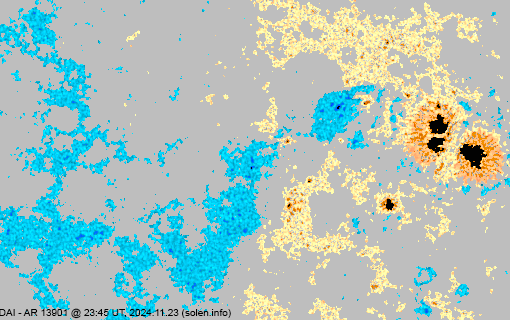 |
beta-gamma area: 0240 location: S07W18 |
| 13898 | 2024.11.17 2024.11.17 |
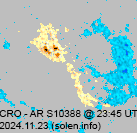
3 | 4 | 2 | S15W83 | 0010 | BXO | CRO |
 |
 |
area: 0015 location: S16W77 |
| 13899 | 2024.11.17 2024.11.17 |
1 | 3 | 1 | S11W41 | 0010 | HSX | HRX |
 |
 |
location: S11W40 |
| S10378 | 2024.11.18 | S20W40 | |||||||||
| S10379 | 2024.11.18 | S17W14 | |||||||||
| S10380 | 2024.11.18 | N20W40 | |||||||||
| S10382 | 2024.11.19 | S04W37 | |||||||||
| S10384 | 2024.11.19 | 9 | 4 | S18W12 | 0030 | BXO |
 |
 |
|||
| S10386 | 2024.11.19 | S01W58 | |||||||||
| 13902 | 2024.11.20 2024.11.20 |
1 | 10 | 2 | S16E22 | 0060 | HSX | CSO |
 |
 |
location: S16E23 area: 0120 |
| S10388 | 2024.11.20 | N22W50 |
 |
||||||||
| S10390 | 2024.11.20 | N27E16 | |||||||||
| 13903 | 2024.11.21 2024.11.21 |
5 | 15 | 6 | S11W60 | 0030 | DAO | DRI |
 |
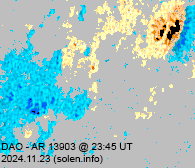 |
location: S11W61 area: 0070 |
| 13905 | 2024.11.21 2024.11.21 |
8 | 39 | 25 | S09E40 | 0250 | EKO | EKI |
 |
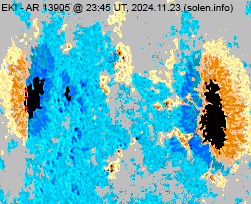 |
beta-gamma-delta location: S09E38 area: 1070 very low SWPC area and spot count |
| S10393 | 2024.11.21 | S37W56 | |||||||||
| S10394 | 2024.11.21 | S19W36 |
 |
||||||||
| 13906 | 2024.11.22 2024.11.22 |
15 | 48 | 30 | S16E47 | 0500 | EKC | EKC |
 |
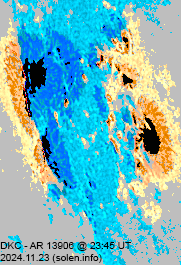 |
beta-gamma-delta location: S16E48 area: 1010 |
| S10396 | 2024.11.22 | 3 | N01W10 | 0006 | AXX |
 |
 |
||||
| S10397 | 2024.11.22 | 4 | 2 | N14E44 | 0010 | AXX |
 |
||||
| 13907 | 2024.11.23 2024.11.23 |
11 | 27 | 14 | S21E01 | 0025 | CRO | DRI |
 |
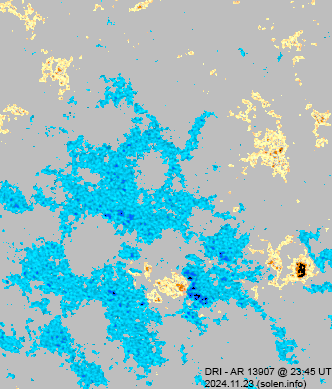 |
beta-gamma was AR S10398 location: S21E04 area: 0080 |
| 13908 | 2024.11.23 2024.11.23 |
6 | 6 | 3 | N14E65 | 0040 | BXO | CRO |
 |
 |
location: N14E66 |
| S10399 | 2024.11.23 | N13E03 |
 |
||||||||
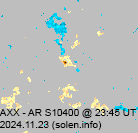
| S10400 | 2024.11.23 | S05W23 |
 |
||||||||
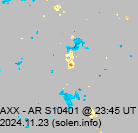
| S10401 | 2024.11.23 | N01E02 |
 |
||||||||
| 13909 | 2024.11.24 | 4 | N25W04 | 0010 | BXO | see AR 13900 | |||||
| S10402 | 2024.11.24 | 8 | 2 | N24E07 | 0015 | BXO |
 |
||||
| Total spot count: | 64 | 222 | 116 | ||||||||
| Sunspot number: | 164 | 362 | 246 | (total spot count + 10 * number of spotted regions) | |||||||
| Weighted SN: | 107 | 270 | 162 | (Sum of total spot count + classification weighting for each AR. Classification weighting: X=0, R=3, A/S=5, H/K=10) | |||||||
| Relative sunspot number (Wolf number): | 180 | 199 | 197 | ||||||||
| Month | Average solar flux | International sunspot number (WDC-SILSO) |
Smoothed sunspot number (4) | Average
ap (3) |
|
|---|---|---|---|---|---|
| Measured | 1 AU | ||||
| 2014.02 | 170.3 (cycle peak) |
166.3 | 146.1 (SC24 peak) | 110.5 | 10.70 |
| 2014.04 | 143.9 | 144.8 | 112.5 | 116.4 (SC24 solar max) | 7.88 |
| 2017.09 | 91.3 | 92.3 | 43.6 | 18.2 (-1.3) | 18.22 (SC24 peak) |
| 2019.11 | 70.2 | 68.7 | 0.5 | 2.0 (-0.6) (Solar minimum using 365d smoothing: November 17, 2019) |
4.19 |
| 2019.12 | 70.8 | 68.6 | 1.6 | 1.8 (-0.2) (ISN 13 months smoothed solar minimum) |
3.22 |
| 2023.03 | 157.2 | 155.6 | 123.3 | 121.1 (+3.3) | 14.42 |
| 2023.04 | 145.4 | 146.4 | 97.6 | 122.9 (+1.8) | 13.40 |
| 2023.05 | 155.6 | 159.2 | 137.4 | 124.2 (+1.3) | 10.67 |
| 2023.06 | 161.7 | 166.8 | 160.5 | 125.3 (+1.1) | 8.95 |
| 2023.07 | 176.4 | 182.2 | 160.0 | 124.6 (-0.7) | 8.15 |
| 2023.08 | 153.7 | 157.6 | 114.8 | 124.3 (-0.3) | 7.19 |
| 2023.09 | 154.4 | 156.0 | 134.2 | 124.0 (-0.3) | 14.26 |
| 2023.10 | 142.8 | 141.9 | 99.4 | 124.8 (+0.8) | 8.16 |
| 2023.11 | 153.5 | 150.2 | 105.4 | 127.9 (+3.1) | 12.20 |
| 2023.12 | 151.1 | 146.4 | 114.2 | 129.5 (+1.6) | 9.60 |
| 2024.01 | 164.6 | 159.3 | 126.0 | 131.1 (+1.6) | 5.46 |
| 2024.02 | 172.5 | 168.3 | 123.0 | 136.9 (+5.8) | 5.31 |
| 2024.03 | 154.4 | 152.9 | 103.7 | 141.4 (+4.5) | 11.03 |
| 2024.04 | 161.3 | 162.6 | 137.0 | 144.4 (+3.1) | 9.69 |
| 2024.05 | 187.7 | 191.9 | 172.1 | (149.7 projected, +5.3) | 23.56 (SC25 peak) |
| 2024.06 | 184.3 | 190.2 | 164.1 | (153.6 projected, +3.9) | 10.24 |
| 2024.07 | 196.6 | 203.0 | 196.5 | (156.5 projected, +2.9) | 7.13 |
| 2024.08 | 246.1 (cycle peak) |
252.2 | 215.5 (SC25 peak) | (158.5 projected, +2.0) | 15.96 |
| 2024.09 | 195.7 | 197.8 | 141.4 | (161.2 projected, +2.7) | 15.36 |
| 2024.10 | 221.0 | 219.6 | 166.3 | (163.5 projected, +2.3) | 18.99 |
| 2024.11 | 193.5 (1) | 115.7 (2A) / 144.6 (2B) / 198.5 (2C) ISN current month average: 150 |
(161.8 projected, -1.7) | (10.1) | |
| 2024.12 | (158.7 projected, -3.1) | ||||
| 2025.01 | (154.4 projected, -4.3) | ||||
| 2025.02 | (147.6 projected, -6.8) | ||||
| 2025.03 | (142.8 projected, -4.8) | ||||
| 2025.04 | (139.8 projected, -3.0) | ||||
1) Running average based on the daily 20:00 UTC observed solar flux value
at 2800 MHz and any corrections applied to that measurement.
2A) Current impact on the monthly sunspot number based on the Boulder
(NOAA/SWPC) sunspot number (accumulated daily sunspots / month days).
2B) Boulder SN current month average to date.
2C) STAR SDO 1K Wolf number 30 day average.
3) Running average based on the quicklook and definitive Potsdam WDC ap
indices. Values in red
are based on the definitive international
GFZ Potsdam WDC ap
indices.
4) Source: WDC-SILSO, Royal Observatory
Of Belgium, Brussels

Sunspot activity in October 2024 increased over September and looks to be headed for an SSN near 160. The average solar flux for October will become the second highest for a month during SC25. The above plot now displays the peak in 365d smoothed sunspot numbers in mid October 2024. ISN has a peak on October 15, NOAA SN on October 14 while both the 1K and 2K SDO SN peaked on October 16. Assuming that the average sunspot number from October 2024 until April 14, 2025 becomes 150, we would be looking at a 365 days smoothed sunspot maximum of 164.5 centered on October 15. Should the average sunspot number for that period become 160 we would get a peak near 169.7.
--------------------------------------------------------------------------------------
This report has been prepared by Jan Alvestad. It is based on the analysis of data from whatever sources are available at the time the report is prepared. All time references are to Universal Time. Comments and suggestions are always welcome.
SDO images are courtesy of NASA/SDO and the AIA, EVE, and HMI science teams.