
The geomagnetic field was very quiet on October 28. The high latitude magnetometer at Andenes recorded inactive conditions.
Solar flux density measured at 20h UT on 2.8 GHz was 111.7 - increasing 21.2 over the previous solar rotation. (Centered 1 year average SF at 1 AU - 183 days ago: 80.53). The Potsdam WDC planetary A index was 1 (STAR Ap - based on the mean of three hour interval ap indices: 1.0). Three hour interval K indices: 00000100 (planetary), 01001310 (Boulder), 00000000 (Andenes).
The background x-ray flux is at the class B3 level (GOES 16).
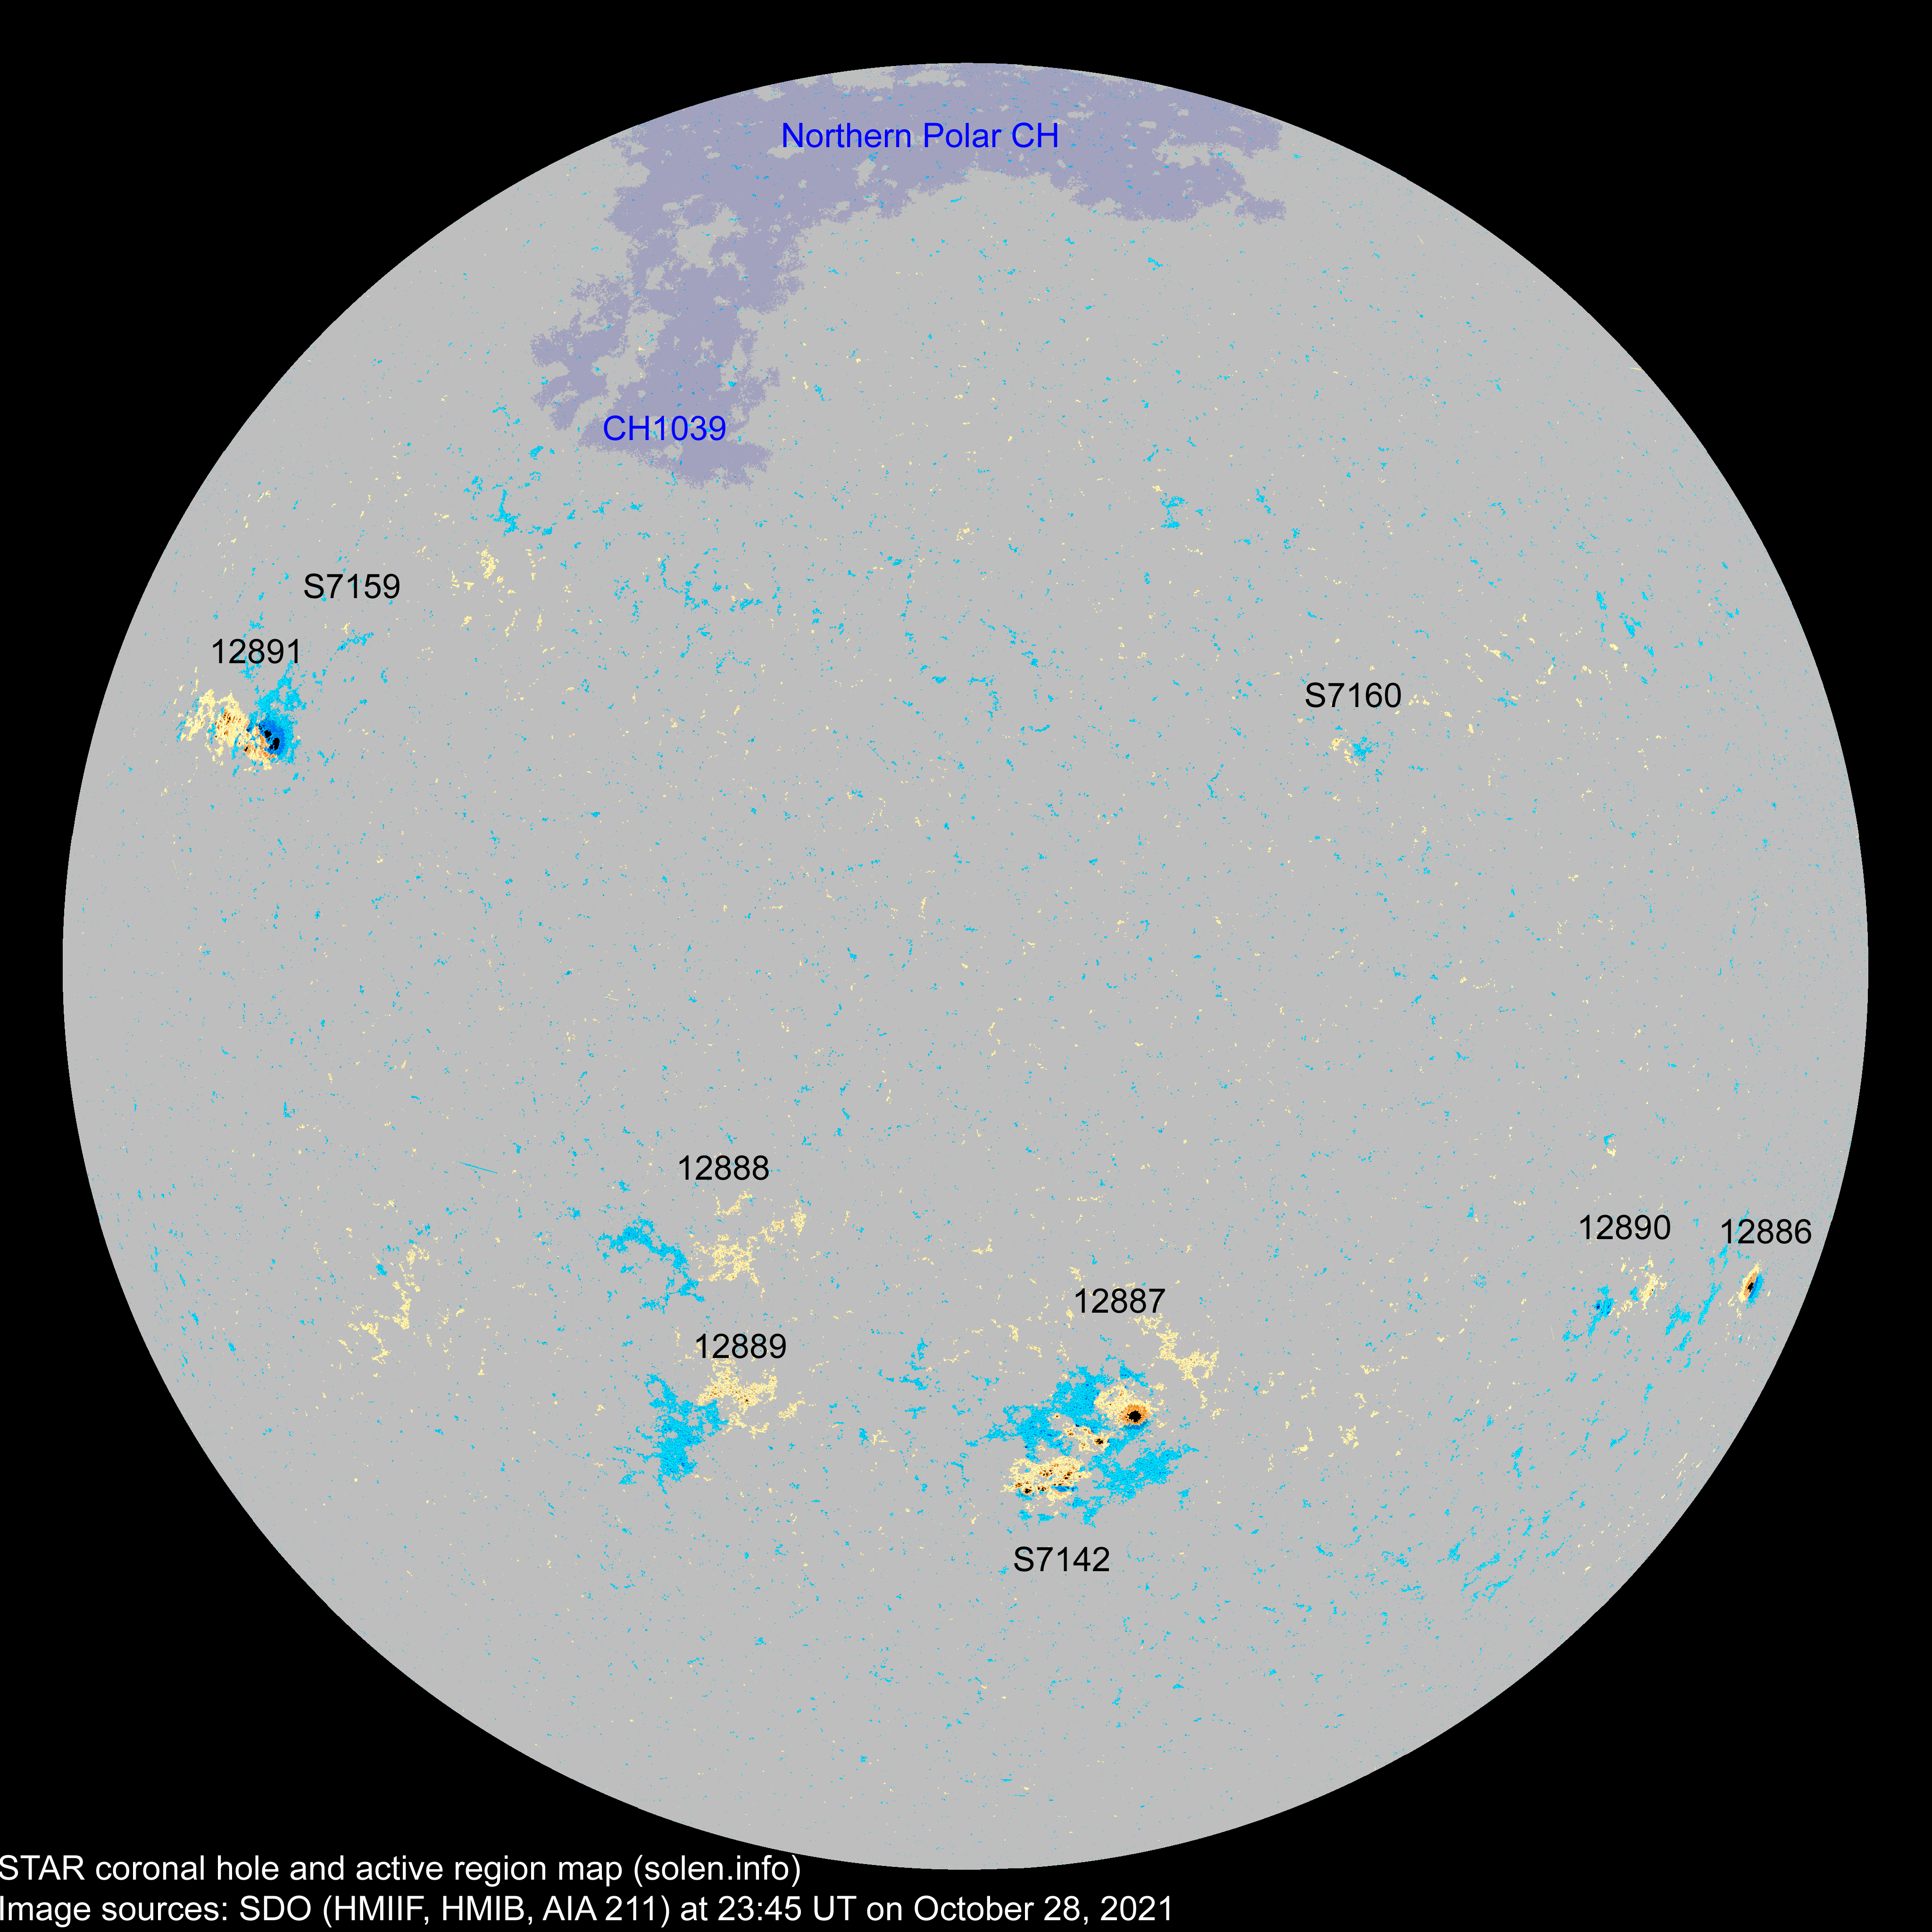
At the time of counting spots (see image time), spots were observed in 9 active regions using 2K resolution (SN: 211) and in 8 active regions using 1K resolution (SN: 138) SDO/HMI images.
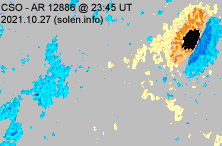
Region 12886 [S18W67]
was quiet and stable.
Region 12887 [S24W11] decayed slowly and quietly. Note that SWPC has
included AR S7142 as part of this region.
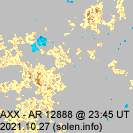
Region 12888 [S13E18] decayed slowly and quietly.
Region 12889 [S23E18] decayed slowly and quietly.
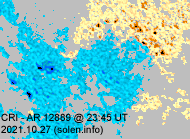
Region 12890 [S18W49] decayed slowly and quietly.
Region 12891 [N18E56] lost the magnetic delta, but is still a compact
region capable of producing M class flares. C1 flares: C1.9 @ 18:42 UT.
Spotted regions not observed (or interpreted
differently) by SWPC:
S7142
[S28W07] decayed significantly losing mature penumbra and both magnetic
delta structures following the major long duration X1 flare at 15:35 UT (A
fast and large EIT wave was associated with this event, as was a large and
dense Earth directed CME. A minor particle event started soon after the
flare). The region still has many small spots. C flares are possible, M
flares are unlikely unless new flux emerges. C1 flares:
C1.2 @ 01:38, C1.1 @ 10:00, C1.2 @ 12:17, C1.5 @ 21:07 UT.
C2+ flares:
| Magnitude | Peak time (UT) | Location | AR | Recorded by | Comment |
| M1.4/1N | 07:40 | S30W03 | S7142 | GOES16 | |
| M2.2/1F | 10:32 | S30W02 | S7142 | GOES16 | |
| C2.2 | 12:38 | N16E60 | 12891 | GOES16 | |
| C3.3/1F | 13:21 | S27W05 | S7142 | GOES16 | simultaneous flare in AR 12891, not sure which one contributed the most |
| C3.8 | 13:59 | S31W03 | S7142 | GOES16 | |
| X1.0/2N | 15:35 | S26W05 | S7142 | GOES16 | LDE, CME, proton event, strong type II and moderate type IV radio sweeps |
| C4.7 | 17:38 | 12891 | GOES16 | ||
| C3.1 | 18:10 | N16E58 | 12891 | GOES16 | |
| C3.1 | 19:45 | 12891 | GOES16 |
October 26-27: No obviously Earth directed CMEs
were observed in available LASCO imagery.
October 28: A large and fast asymmetric CME was observed after the X1
flare in AR S7142. The CME will likely reach Earth during the first half of
October 30 and cause active the very severe geomagnetic storming.
[Coronal hole history (since October 2002)]
[Compare today's report to the situation one solar rotation ago:
28 days ago
27 days ago
26 days ago]
An extension (CH1039) of the northern pole coronal hole could rotate across the central meridian on October 31.

Long distance low and medium frequency (below 2 MHz) propagation along paths north of due west over upper middle and high latitudes is poor due to an ongoing proton event. Propagation on long distance northeast-southwest paths is poor.
The geomagnetic field is expected to be quiet on October 29. Active to very severe storm levels are possible on October 30-31 due to the October 28 CME.
| Coronal holes (1) | Coronal mass ejection (2) | M and X class flares (3) |
1) Effects from a coronal hole
could reach Earth within the next 5 days. When the high speed
stream has arrived the color changes to green.
2) Effects from a CME are likely to be observed at Earth within 96 hours.
3) There is a possibility of either M or X class flares within the next 48 hours.
Green: 0-30% probability, Yellow: 30-70% probability, Red: 70-100% probability.

(Click on image for 2K resolution).
4K resolution.
Compare to the previous day's image. 0.5K image
When available the active region map has a coronal hole polarity overlay where red (pink) is negative and blue is positive.
Data for all officially numbered solar regions according to the Solar Region Summary provided by NOAA/SWPC, all other regions are numbered sequentially as they emerge using the STAR spot number. Comments are my own, as is the STAR spot count (spots observed at or inside a few hours before midnight) and data for regions not numbered by SWPC or where SWPC has observed no spots. SWPC active region numbers in the table below and in the active region map above are the historic SWPC/USAF numbers. SWPC data considered to be not sufficiently precise (location, area, classification) are red colored.
| Active region | SWPC date numbered STAR detected |
Spot count | Location at midnight | Area | Classification | SDO / HMI 4K continuum image with magnetic polarity overlays |
Comment | ||||
|---|---|---|---|---|---|---|---|---|---|---|---|
| SWPC/ USAF |
Magnetic (SDO) |
SWPC | STAR | Current | Previous | ||||||
| 2K | 1K | ||||||||||
| 12886 | 2021.10.17 2021.10.18 |
1 | 1 | 1 | S19W68 | 0100 | HSX | HSX |
 |
 |
|
| S7136 | 2021.10.19 | N23W52 | |||||||||
| 12887 | 2021.10.21 2021.10.22 |
28 | 18 | 5 | S26W08 | 0320 | DKC | CSO |
 |
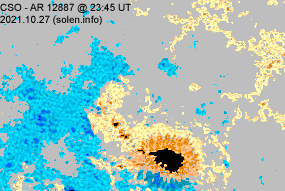 |
location: S24W11 area: 0130 SWPC data includes AR S7142 |
| S7142 | 2021.10.21 | 46 | 28 | S28W07 | 0270 | DRI |
 |
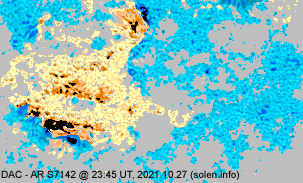 |
beta-gamma | ||
| S7143 | 2021.10.22 | S13W36 | |||||||||
| S7144 | 2021.10.22 | N14W34 | |||||||||
| S7145 | 2021.10.23 | S24W41 | |||||||||
| 12888 | 2021.10.23 2021.10.24 |
2 | 1 | S12E13 | 0004 | BXO |
 |
 |
|||
| 12889 | 2021.10.24 2021.10.25 |
4 | 18 | 6 | S23E17 | 0030 | BXO | BXO |
 |
 |
|
| S7148 | 2021.10.24 | N21W17 | |||||||||
| S7149 | 2021.10.24 | N01W22 | |||||||||
| 12890 | 2021.10.25 2021.10.25 |
3 | 8 | 4 | S18W52 | 0030 | BXO | CRO |
 |
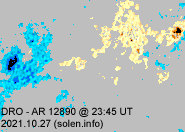 |
location: S18W49 area: 0020 |
| S7151 | 2021.10.25 | N14W16 | |||||||||
| S7152 | 2021.10.25 | S34W36 | |||||||||
| 12891 | 2021.10.26 2021.10.26 |
10 | 25 | 12 | N18E56 | 0220 | CAI | DKC |
 |
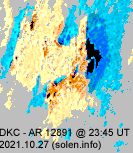 |
beta-gamma area: 0380 |
| S7155 | 2021.10.26 | N33W18 | |||||||||
| S7156 | 2021.10.26 | N13W15 | |||||||||
| S7157 | 2021.10.26 | S23E01 | |||||||||
| S7158 | 2021.10.27 | N37W17 | |||||||||
| S7159 | 2021.10.28 | 1 | N24E49 | 0002 | AXX |
 |
|||||
| S7160 | 2021.10.28 | 2 | 1 | N19W26 | 0003 | BXO |
 |
||||
| Total spot count: | 46 | 121 | 58 | ||||||||
| Sunspot number: | 96 | 211 | 138 | (total spot count + 10 * number of spotted regions) | |||||||
| Weighted SN: | 66 | 147 | 84 | (Sum of total spot count + classification weighting for each AR. Classification weighting: X=0, R=3, A/S=5, H/K=10) | |||||||
| Relative sunspot number (Wolf number): | 106 | 116 | 110 | ||||||||
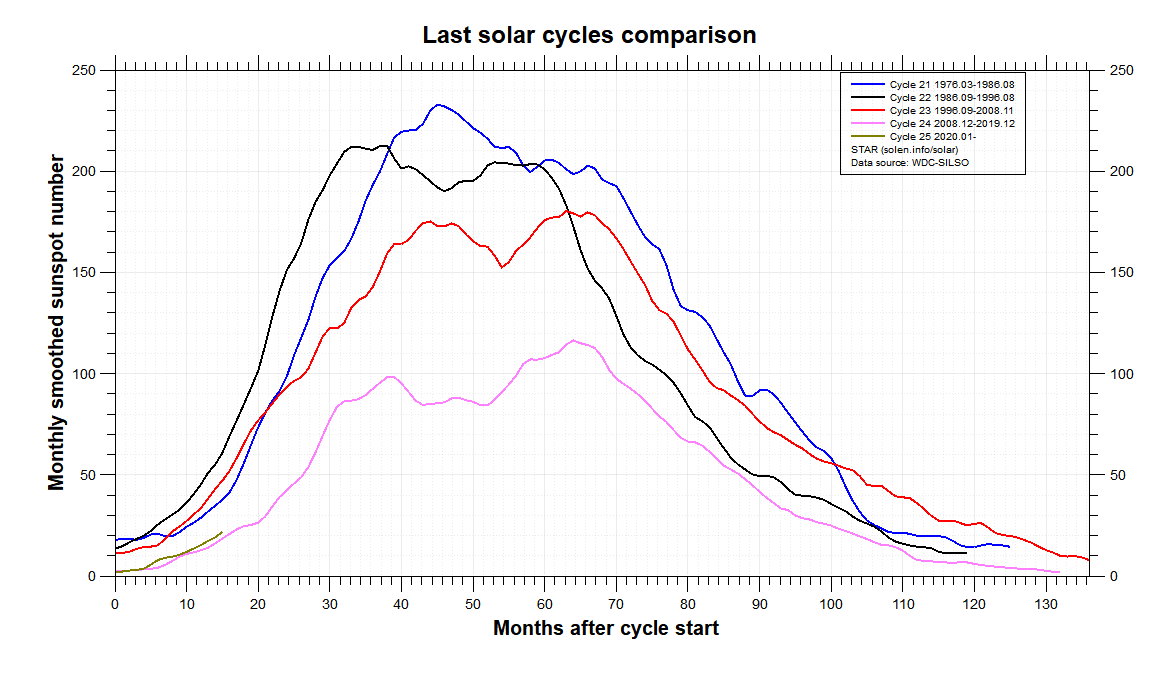
| Month | Average solar flux | International sunspot number (WDC-SILSO) |
Smoothed sunspot number (4) | Average ap (3) |
|
|---|---|---|---|---|---|
| Measured | 1 AU | ||||
| 2014.02 | 170.3 (cycle peak) |
166.3 | 146.1 (cycle peak) | 110.5 | 10.70 |
| 2014.04 | 143.9 | 144.8 | 112.5 | 116.4 (solar max) | 7.88 |
| 2017.09 | 91.3 | 92.3 | 43.6 | 18.2 (-1.3) | 18.22 (cycle peak) |
| 2019.11 | 70.2 | 68.7 | 0.5 | 2.0 (-0.6) (Solar minimum using 365d smoothing: November 17, 2019) |
4.19 |
| 2019.12 | 70.8 | 68.6 | 1.6 | 1.8 (-0.2) (ISN 13 months smoothed solar minimum) |
3.22 |
| 2020.04 | 69.5 | 70.0 | 5.4 | 3.6 (+0.6) | 5.32 |
| 2020.05 | 69.0 | 70.6 | 0.2 | 5.6 (+2.0) | 3.80 |
| 2020.06 | 69.5 | 71.7 | 5.8 | 7.9 (+2.3) | 3.75 |
| 2020.07 | 69.5 | 71.8 | 6.3 | 9.0 (+1.1) | 4.28 |
| 2020.08 | 71.6 | 73.4 | 7.6 | 9.5 (+0.5) | 5.68 |
| 2020.09 | 70.7 | 71.4 | 0.7 | 10.5 (+1.0) | 8.59 |
| 2020.10 | 74.6 | 74.2 | 14.6 | 11.9 (+1.4) | 6.13 |
| 2020.11 | 89.9 | 88.0 | 34.5 | 13.6 (+1.7) | 4.77 |
| 2020.12 | 86.9 | 84.2 | 23.1 | 15.3 (+1.7) | 4.72 |
| 2021.01 | 76.0 | 73.6 | 10.4 | 17.3 (+2.0) | 4.39 |
| 2021.02 | 74.3 | 72.4 | 8.3 | 19.1 (+1.8) | 9.50 |
| 2021.03 | 76.0 | 75.2 | 17.3 | 21.8 (+2.7) | 10.17 |
| 2021.04 | 75.9 | 76.4 | 24.5 | (26.0 projected, +4.2) | 8.40 |
| 2021.05 | 75.3 | 77.1 | 21.2 | (28.7 projected, +2.7) | 6.50 |
| 2021.06 | 79.4 | 81.8 | 25.3 | (31.9 projected, +3.2) | 5.52 |
| 2021.07 | 81.0 | 83.6 | 34.4 | (36.5 projected, +4.6) | 5.51 |
| 2021.08 | 77.7 | 79.7 | 22.4 | (41.1 projected, +4.6) | 6.19 |
| 2021.09 | 87.0 | 88.2 | 51.5 | (46.8 projected, +5.7) | 6.33 |
| 2021.10 | 87.1 (1) | 28.8 (2A) / 31.9 (2B) / 42.0 (2C) | (51.2 projected, +4.4) | (7.2) | |
| 2021.11 | (55.8 projected, +4.6) | ||||
| 2021.12 | (61.7 projected, +5.9) | ||||
| 2022.01 | (65.3 projected, +3.6) | ||||
| 2022.02 | (70.0 projected, +4.7) | ||||
| 2022.03 | (75.4 projected, +5.4) | ||||
1) Running average based on the daily 20:00 UTC observed solar flux value at 2800 MHz
and any corrections applied to that measurement.
2A) Current impact on the monthly sunspot number based on the Boulder (NOAA/SWPC) sunspot number (accumulated daily sunspots / month days).
2B) Boulder SN current month average to date.
2C) STAR SDO 1K Wolf number 30 day average.
3) Running average based on the quicklook and definitive Potsdam WDC ap indices. Values in red
are based on the definitive international
GFZ Potsdam WDC ap indices.
4) Source: SIDC-SILSO.

This report has been prepared by Jan Alvestad. It is based on the analysis of data from whatever sources are available at the time the report is prepared. All time references are to Universal Time. Comments and suggestions are always welcome.
SDO images are courtesy of NASA/SDO and the AIA, EVE, and HMI science teams.