
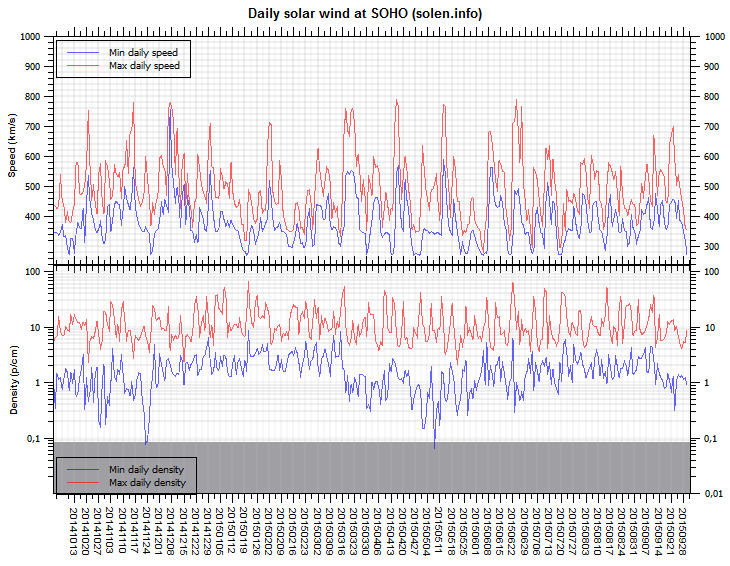
The geomagnetic field was quiet to major storm on September 7. Solar wind speed at SOHO ranged between 440 and 574 km/s. While the geomagnetic field was under the influence of a high speed stream from CH687 early in the day, significant changes in the solar wind occured after noon. Wind speed and density increased and the total field of the IMF increased while Bz swung moderately to strongly southwards. This caused minor to major geomagnetic storming for the remainder of the day. The source of the disturbance during the latter half of the day is uncertain, by far the most likely candidate appears to be a CME associated with a large filament eruption in the southeast quadrant (starting from approx. 18h UT) on September 4. Although this CME appeared to be just outside of the Sun-Earth axis, the CME may have merged with the trailing part of the CHHSS.
Solar flux at 20h UTC on 2.8 GHz was 83.7 (decreasing 19.1 over the last solar rotation). The 90 day 10.7 flux at 1 AU was 111.7. The Potsdam WDC planetary A index was 41 (STAR Ap - based on the mean of three hour interval ap indices: 40.9). Three hour interval K indices: 23435656 (planetary), 24435554 (Boulder).
The background x-ray flux is at the class A8 level.
At the time of counting spots (see image time), spots were observed in 9 active regions using 2K resolution (SN: 124) and 5 active regions using 1K resolution (SN: 64) SDO images on the visible solar disk.
Region 12409 [N05W21] decayed slowly and quietly.
Region 12411 [N14E25] was quiet and stable.
Region 12412 [S07E47] gained spots and was quiet.
New region 12413 [N02W46] emerged early in the day with a few spots.
Spotted regions not numbered (or interpreted differently) by SWPC:
S4740 [S23W24] was quiet and stable.
New region S4743 [N06E48] emerged with a penumbra
spot.
New region S4744 [N08E70] emerged with a penumbra spot near the
northeast limb.
New region S4745 [S12W03] was observed with penumbra spots.
New region S4746 [N20E14] emerged with penumbra
spots. The leading and trailing spot sections may be 2 separate regions.
C2+ flares:
| Magnitude | Peak time (UTC) | Location | AR | Recorded by | Comment |

September 5-7: No obviously Earth directed CMEs were observed.
[Coronal hole
history (since October 2002)]
[Compare today's report to the situation one solar rotation ago:
28 days ago
27 days ago
26 days ago]
A trans equatorial coronal hole (CH688) will be in an Earth facing position on September 7-8.

Long distance low and medium frequency (below 2 MHz) propagation along paths north of due west over upper middle latitudes is poor. Propagation on long distance northeast-southwest paths is poor to fair.
The geomagnetic field is expected to be quiet to active on September 8 due to CME effects and quiet on September 9. Quiet to unsettled conditions are possible on September 10-11 due to effects from CH688.
| Coronal holes (1) | Coronal mass ejection (2) | M and X class flares (3) |
1) Effects from a coronal hole could reach Earth within the
next 5 days. When the high speed stream has arrived the color changes to green.
2) Effects from a CME are likely to be observed at Earth within 96 hours.
3) There is a possibility of either M or X class flares within the next 48
hours.
Green: 0-30% probability, Yellow: 30-70% probability, Red: 70-100% probability.
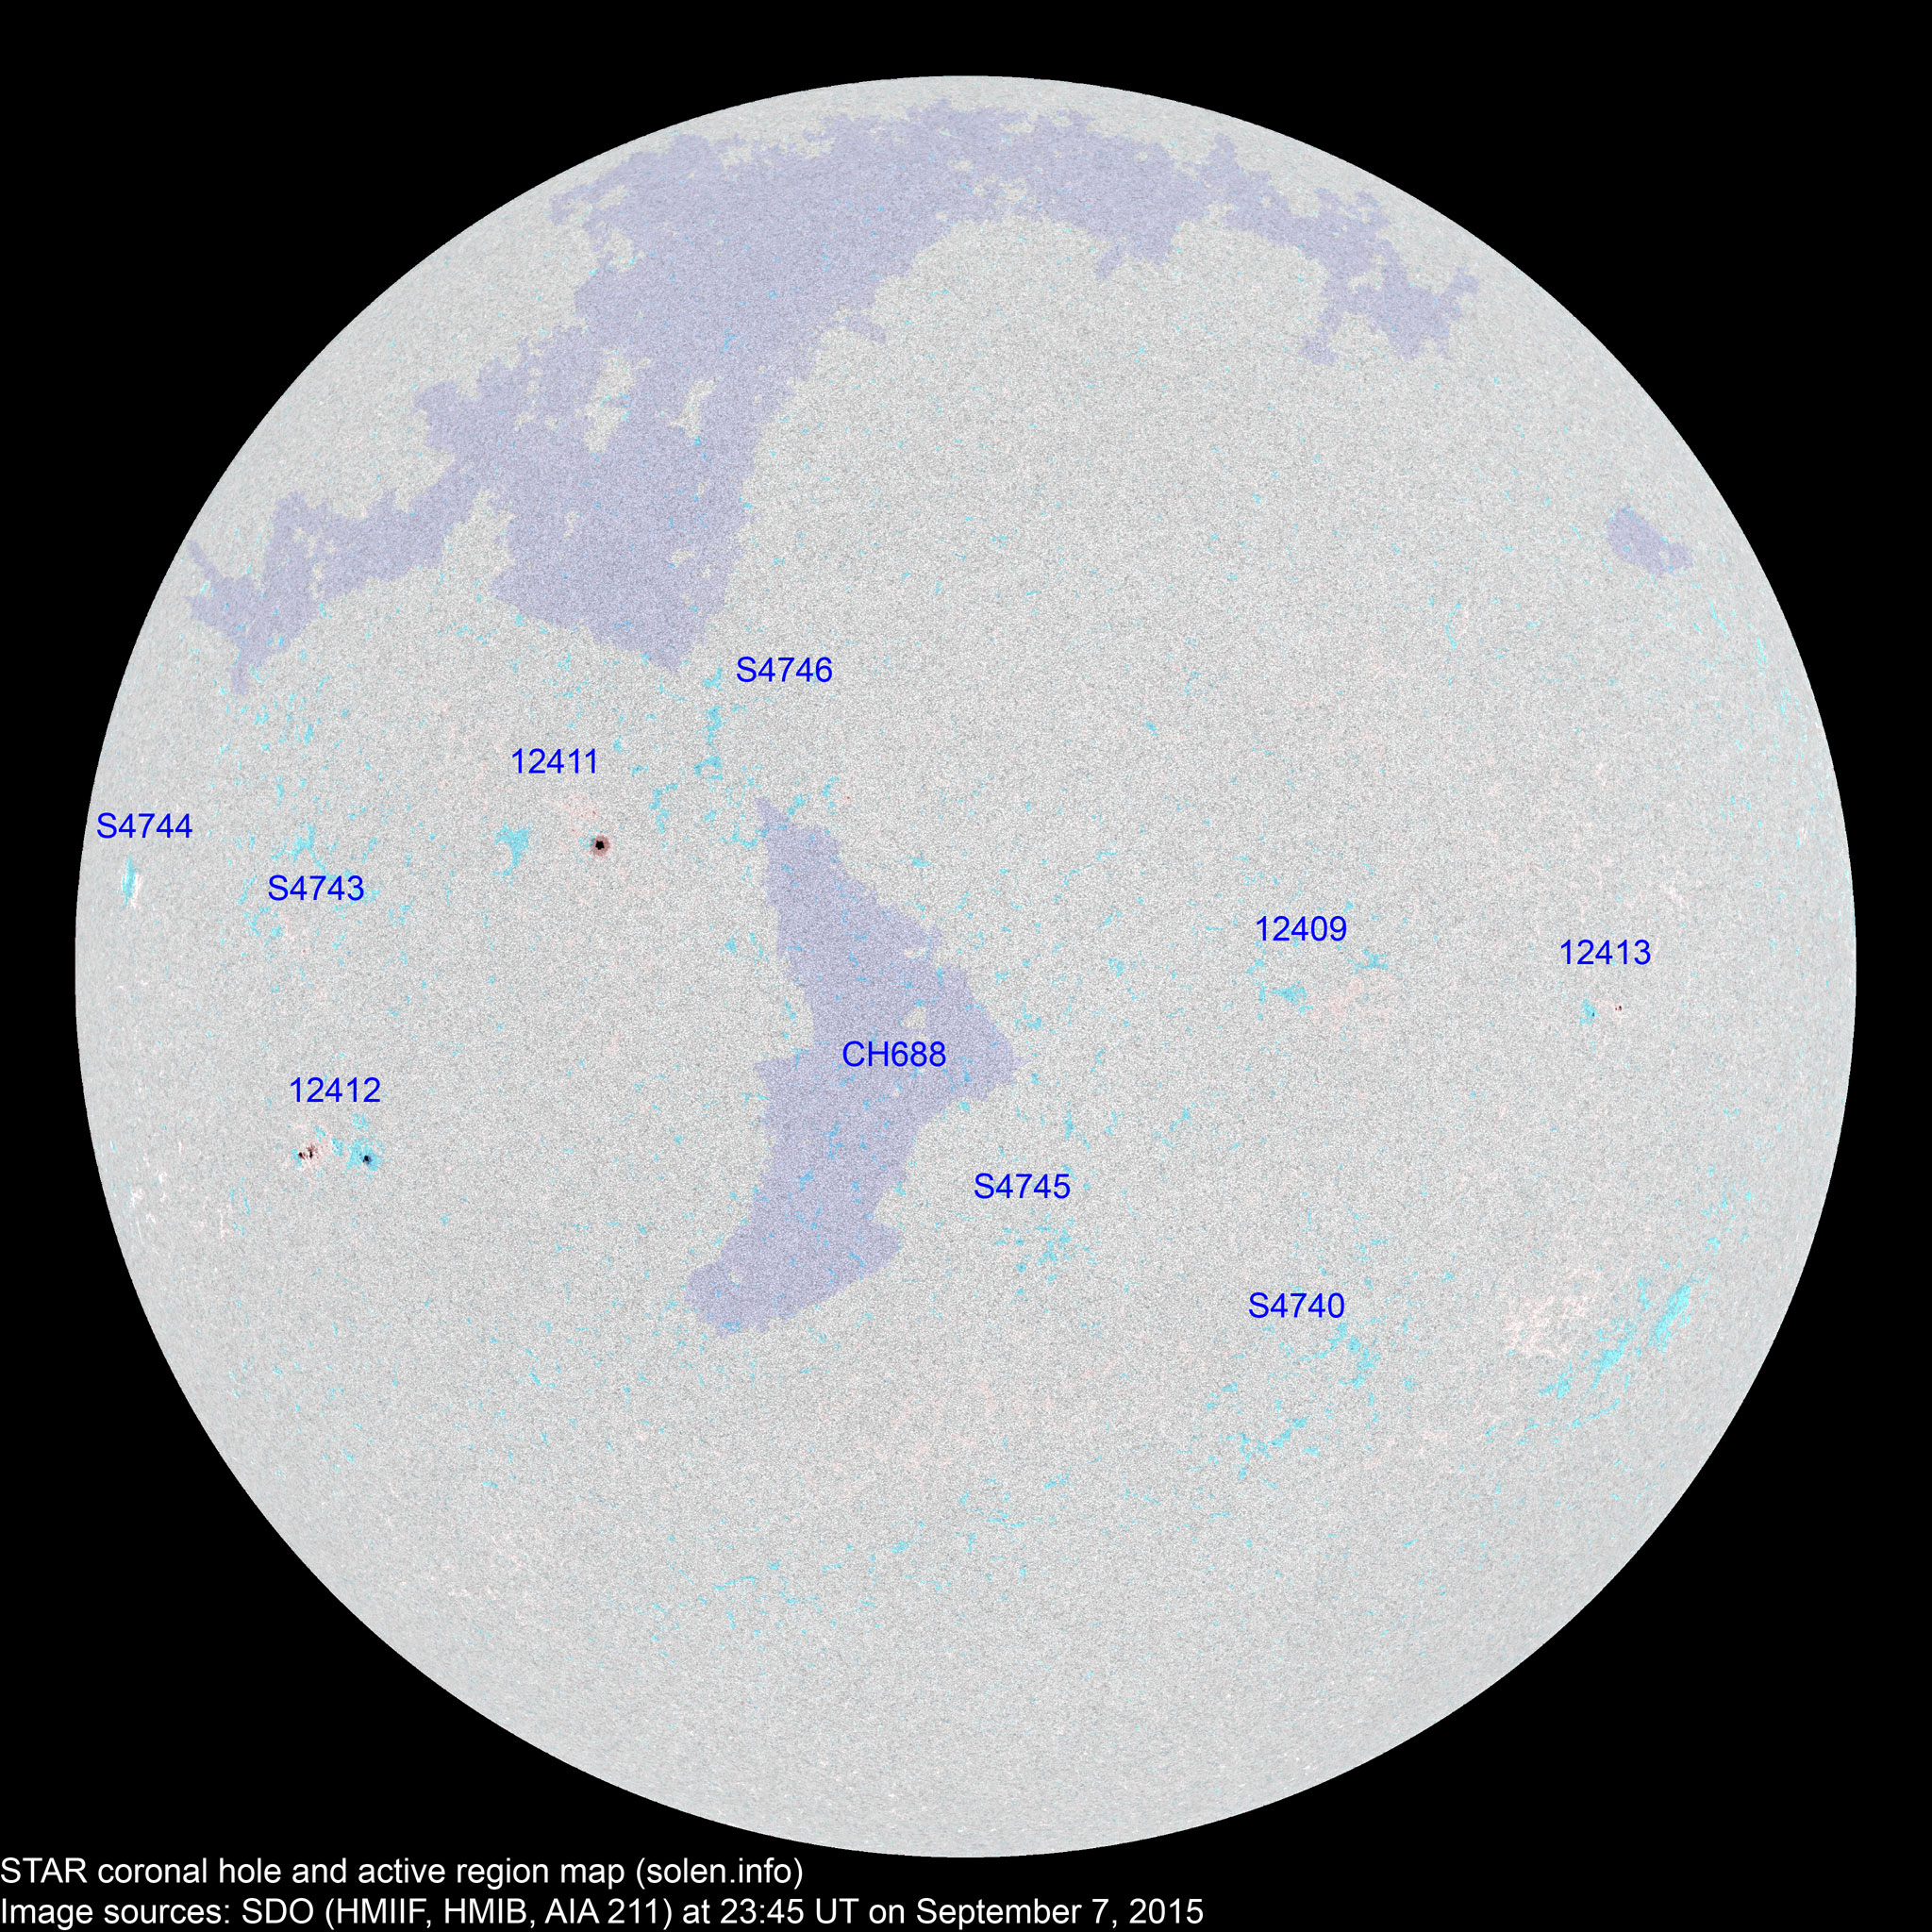
(Click on image for 2K resolution)
Compare to the previous day's image.
When available the active region map has a coronal hole polarity overlay where red (pink) is negative and blue is positive.
Data for all numbered solar regions according to the Solar Region Summary provided by NOAA/SWPC. Comments are my own, as is the STAR spot count (spots observed at or inside a few hours before midnight) and data for regions not numbered by SWPC or where SWPC has observed no spots. SWPC active region numbers in the table below and in the active region map above are the historic SWPC/USAF numbers.
| Active region | Date numbered detected |
Spot count | Location at midnight | Area | Classification | SDO / HMI 4K continuum image with magnetic polarity overlays |
Comment | ||||
|---|---|---|---|---|---|---|---|---|---|---|---|
| SWPC | Magnetic (SDO) |
SWPC | STAR | Current | Previous | ||||||
| 2K | 1K | ||||||||||
| S4725 | 2015.08.30 | S18W43 |
 |
||||||||
| 12409 | 2015.08.31 2015.09.01 |
1 | 2 | N05W25 | 0000 | AXX | AXX |
 |
 |
location: N05W21 area: 0003 |
|
| 12410 | 2015.09.02 2015.09.03 |
S19W32 | |||||||||
| 12411 | 2015.09.03 2015.09.04 |
1 | 4 | 3 | N14E24 | 0030 | HSX | HSX |
 |
 |
area: 0080 |
| 12412 | 2015.09.05 2015.09.06 |
4 | 14 | 5 | S07E44 | 0040 | DAO | DRI |
 |
 |
|
| S4740 | 2015.09.06 | 2 | S23W24 | 0005 | AXX |
 |
 |
||||
| S4741 | 2015.09.06 | S35W44 |
 |
||||||||
| 12413 | 2015.09.07 | 1 | 3 | 3 | N02W47 | 0010 | HRX | CRO |
 |
||
| S4743 | 2015.09.07 | 1 | 1 | N06E48 | 0004 | AXX |
 |
||||
| S4744 | 2015.09.07 | 1 | N08E70 | 0001 | AXX |
 |
|||||
| S4745 | 2015.09.07 | 2 | S12W03 | 0004 | AXX |
 |
|||||
| S4746 | 2015.09.07 | 5 | 2 | N20E14 | 0013 | BXO |
 |
||||
| Total spot count: | 7 | 34 | 14 | ||||||||
| Sunspot number: | 47 | 124 | 64 | (total spot count + 10 * number of spotted regions) | |||||||
| Weighted SN: | 20 | 45 | 25 | (Sum of total spot count + classification weighting for each AR. Classification weighting: X=0, R=3, A/S=5, H/K=10) | |||||||
| Relative sunspot number (Wolf number): | 52 | 68 | 54 | k * (sunspot number) As of July 1, 2015: k = 1.1 for SWPC, k = 0.55 for MSN 2K, k = 0.85 for MSN 1K (MSN=Magnetic Sunspot Number) |
|||||||
| Month | Average solar flux | International sunspot number (WDC-SILSO) (4) |
Smoothed sunspot number (4) | Average
ap (3) |
|
|---|---|---|---|---|---|
| Measured | 1 AU | ||||
| 2014.02 | 170.3 (cycle peak) |
166.3 | 146.1 (cycle peak) | 110.5 (+1.2) | 10.70 |
| 2014.04 | 143.9 | 144.8 | 112.5 | 116.4 (+2.1) (solar max) | 7.88 |
| 2014.05 | 129.7 | 132.9 | 112.5 | 115.0 (-1.4) | 5.75 |
| 2014.06 | 122.0 | 125.8 | 102.9 | 114.1 (-0.9) | 6.72 |
| 2014.07 | 137.4 | 141.8 | 100.2 | 112.6 (-1.5) | 4.50 |
| 2014.08 | 124.7 | 127.9 | 106.9 | 108.3 (-4.3) | 7.71 |
| 2014.09 | 146.6 | 148.1 | 130.0 | 101.9 (-6.4) | 9.78 |
| 2014.10 | 153.4 | 152.9 | 90.0 | 97.4 (-4.5) | 8.96 |
| 2014.11 | 154.8 | 151.4 | 103.6 | 95.0 (-2.4) | 9.33 |
| 2014.12 | 158.7 | 153.8 | 112.9 | 92.6 (-2.4) | 11.24 |
| 2015.01 | 141.9 | 137.3 | 93.0 | 89.8 (-2.8) | 9.46 |
| 2015.02 | 129.1 | 126.0 | 66.7 | 86.6 (-3.2) | 9.92 |
| 2015.03 | 125.9 | 124.6 | 54.5 | (82.1 projected, -4.5) | 16.14 |
| 2015.04 | 128.8 | 129.7 | 78.0 | (78.0 projected, -4.1) | 10.73 |
| 2015.05 | 120.0 | 122.6 | 90.0 | (75.3 projected, -2.7) | 8.29 |
| 2015.06 | 122.3 | 126.1 | 68.3 | (71.6 projected, -3.7) | 13.15 |
| 2015.07 | 107.0 | 110.8 | 66.4 | (67.9 projected, -3.7) | 8.83 |
| 2015.08 | 105.4 | 108.0 | 64.6 | (66.7 projected, -1.2) | 13.8 |
| 2015.09 | (86.9) | 8.7 (2A) / 37.4 (2B) / 62.8 (2C) | (67.0 projected, +0.3) | (14.8) | |
1) Running average based on the daily 20:00 UTC observed solar flux value at
2800 MHz.
2A) Current impact on the monthly sunspot number based on the Boulder
(NOAA/SWPC) sunspot number (accumulated daily sunspots / month days).
2B)
Boulder SN current month average to date.
2C) STAR SDO 1K Wolf number 30 day
average.
3) Running average based on the quicklook and definitive Potsdam WDC ap
indices. Values in red are based on the definitive
international
GFZ Potsdam
WDC
ap indices.
4) Updated to new data set from WDC-SILSO on July 1, 2015
This report has been prepared by Jan Alvestad. It is based on the analysis of data from whatever sources are available at the time the report is prepared. All time references are to Universal Time. Comments and suggestions are always welcome.
SDO images are courtesy of NASA/SDO and the AIA, EVE, and HMI science teams.