
Last major update issued on September 24, 2011 at 04:30 UTC. Last minor update posted at 19:30 UTC
[Solar and geomagnetic data - last month (updated
daily)]
[Solar wind and electron fluence charts (updated
daily)
[Solar cycles 21-24 (last update
September 1, 2011)]
[Solar cycles 1-20]
[Graphical comparison of cycles 21, 22, 23 and 24 (last
update September 1, 2011)]
[Graphical comparison of cycles 10, 12, 13, 14, 16 and
24 (last update September 1, 2011)]
[Historical solar and geomagnetic data charts 1954-2006
(last update April 5, 2007)]
[Archived reports since January 2003 (last update
September 1, 2011)]
[POES auroral activity level since October
2009 - updated September 23, 2011]
Annotated geomagnetic activity charts - Carrington rotation
2112 [July
2011] -
2113 [July-August
2011]
[Solar polar fields vs solar cycles - updated
June 27, 2011]
The geomagnetic field was quiet on September 23. Solar wind speed ranged between 342 and 373 km/s.
Solar flux measured at 20h UTC on 2.8 GHz was 158.2 (increasing 54.4 over the last solar rotation, and the highest non-flare influenced solar flux measurement of cycle 24). The planetary A index was 3 (STAR Ap - based on the mean of three hour interval ap indices: 3.0). Three hour interval K indices: 10001111 (planetary), 11012111 (Boulder).
The background x-ray flux is at the class C1 level.
At midnight UTC the visible solar disk had 5 spotted regions (in 2K resolution SDO images).
Region 11295 [N24W76] displayed impressive growth in penumbral area.
The region has a magnetic delta structure and could produce a major (proton)
flare before rotating out of view. Flares:
M1.6/1N long duration event peaking at 02:00, C2.7 at 08:19, C3.2 at 12:23, C2.2
at 20:49 UTC.
Region 11296 [N25W57] was mostly quiet and stable.
Region 11301 [N20E14] was quiet and stable. The region has many tiny,
widely scattered spots.
Region 11302 [N13E64] is magnetically very complex, particularly in the
central part, and has multiple magnetic delta structures. M and X class flares
are possible. Flare: C9.6 at 00:33, C6.9 at
08:50 (wrongly attributed to 11295 by SWPC), C3.4 at 19:11, C9.6 at 21:43 (wrongly
attributed to 11295 by SWPC) , M1.6 at 22:15 (wrongly attributed to 11295 by
SWPC), M1.9/1N at 23:56 UTC.
Spotted regions not numbered by NOAA/SWPC:
[S1230] emerged in the southwest quadrant on September 23. Location at midnight:
S27W53
Minor update added at 15:10 UTC on September 24: Region 11302 has produced 2 major events so far today, first an X1.9 flare at 09:40 (associated with a small CME), then the more important M7.1 long duration event peaking at 13:20 UTC. The latter event was associated with a large, bright and wide CME which appears to be asymmetrical full halo in LASCO. The CME could reach Earth on September 26 or 27 and cause active to major storm conditions.
Minor update added at 19:30 UTC: Flare activity has been at an extreme level for the past 3 hours as both regions 11295 and 11302 have produced several M flares. First region 11295 was the origin of an M1.7 flare at 16:58, then region 11302 produced an M3.1 flare at 17:24 and an M2.8 flare at 18:05. Region 11295 was the source of another eruption at 18:19 UTC, this time an M2.7 flare. Finally region 11302 managed an M3.0 flare at 19:21 UTC. Region 11302 continues to be very complex in the central part with opposite polarity umbrae hard to separate in SDO 4K images. Region 11295 has developed a strong magnetic delta in the the trailing penumbra and could soon produce a major flare. New region S1231 is rotating into view at the northeast limb as an HSX group while new region S1232 has emerged between regions 11302 and 11301. The latest high resolution CHARMAP.
September 21 and 23: No obviously Earth directed CMEs observed.
September 22: An unusually large and wide CME was observed after the X1.4
event in region 11302. While it is rare that limb events cause geomagnetic
storming, this CME could when it arrives, probably on September 25.
Coronal hole history (since late October
2002)
Compare today's report to the situation one solar rotation ago:
28 days ago
27 days ago
26 days ago
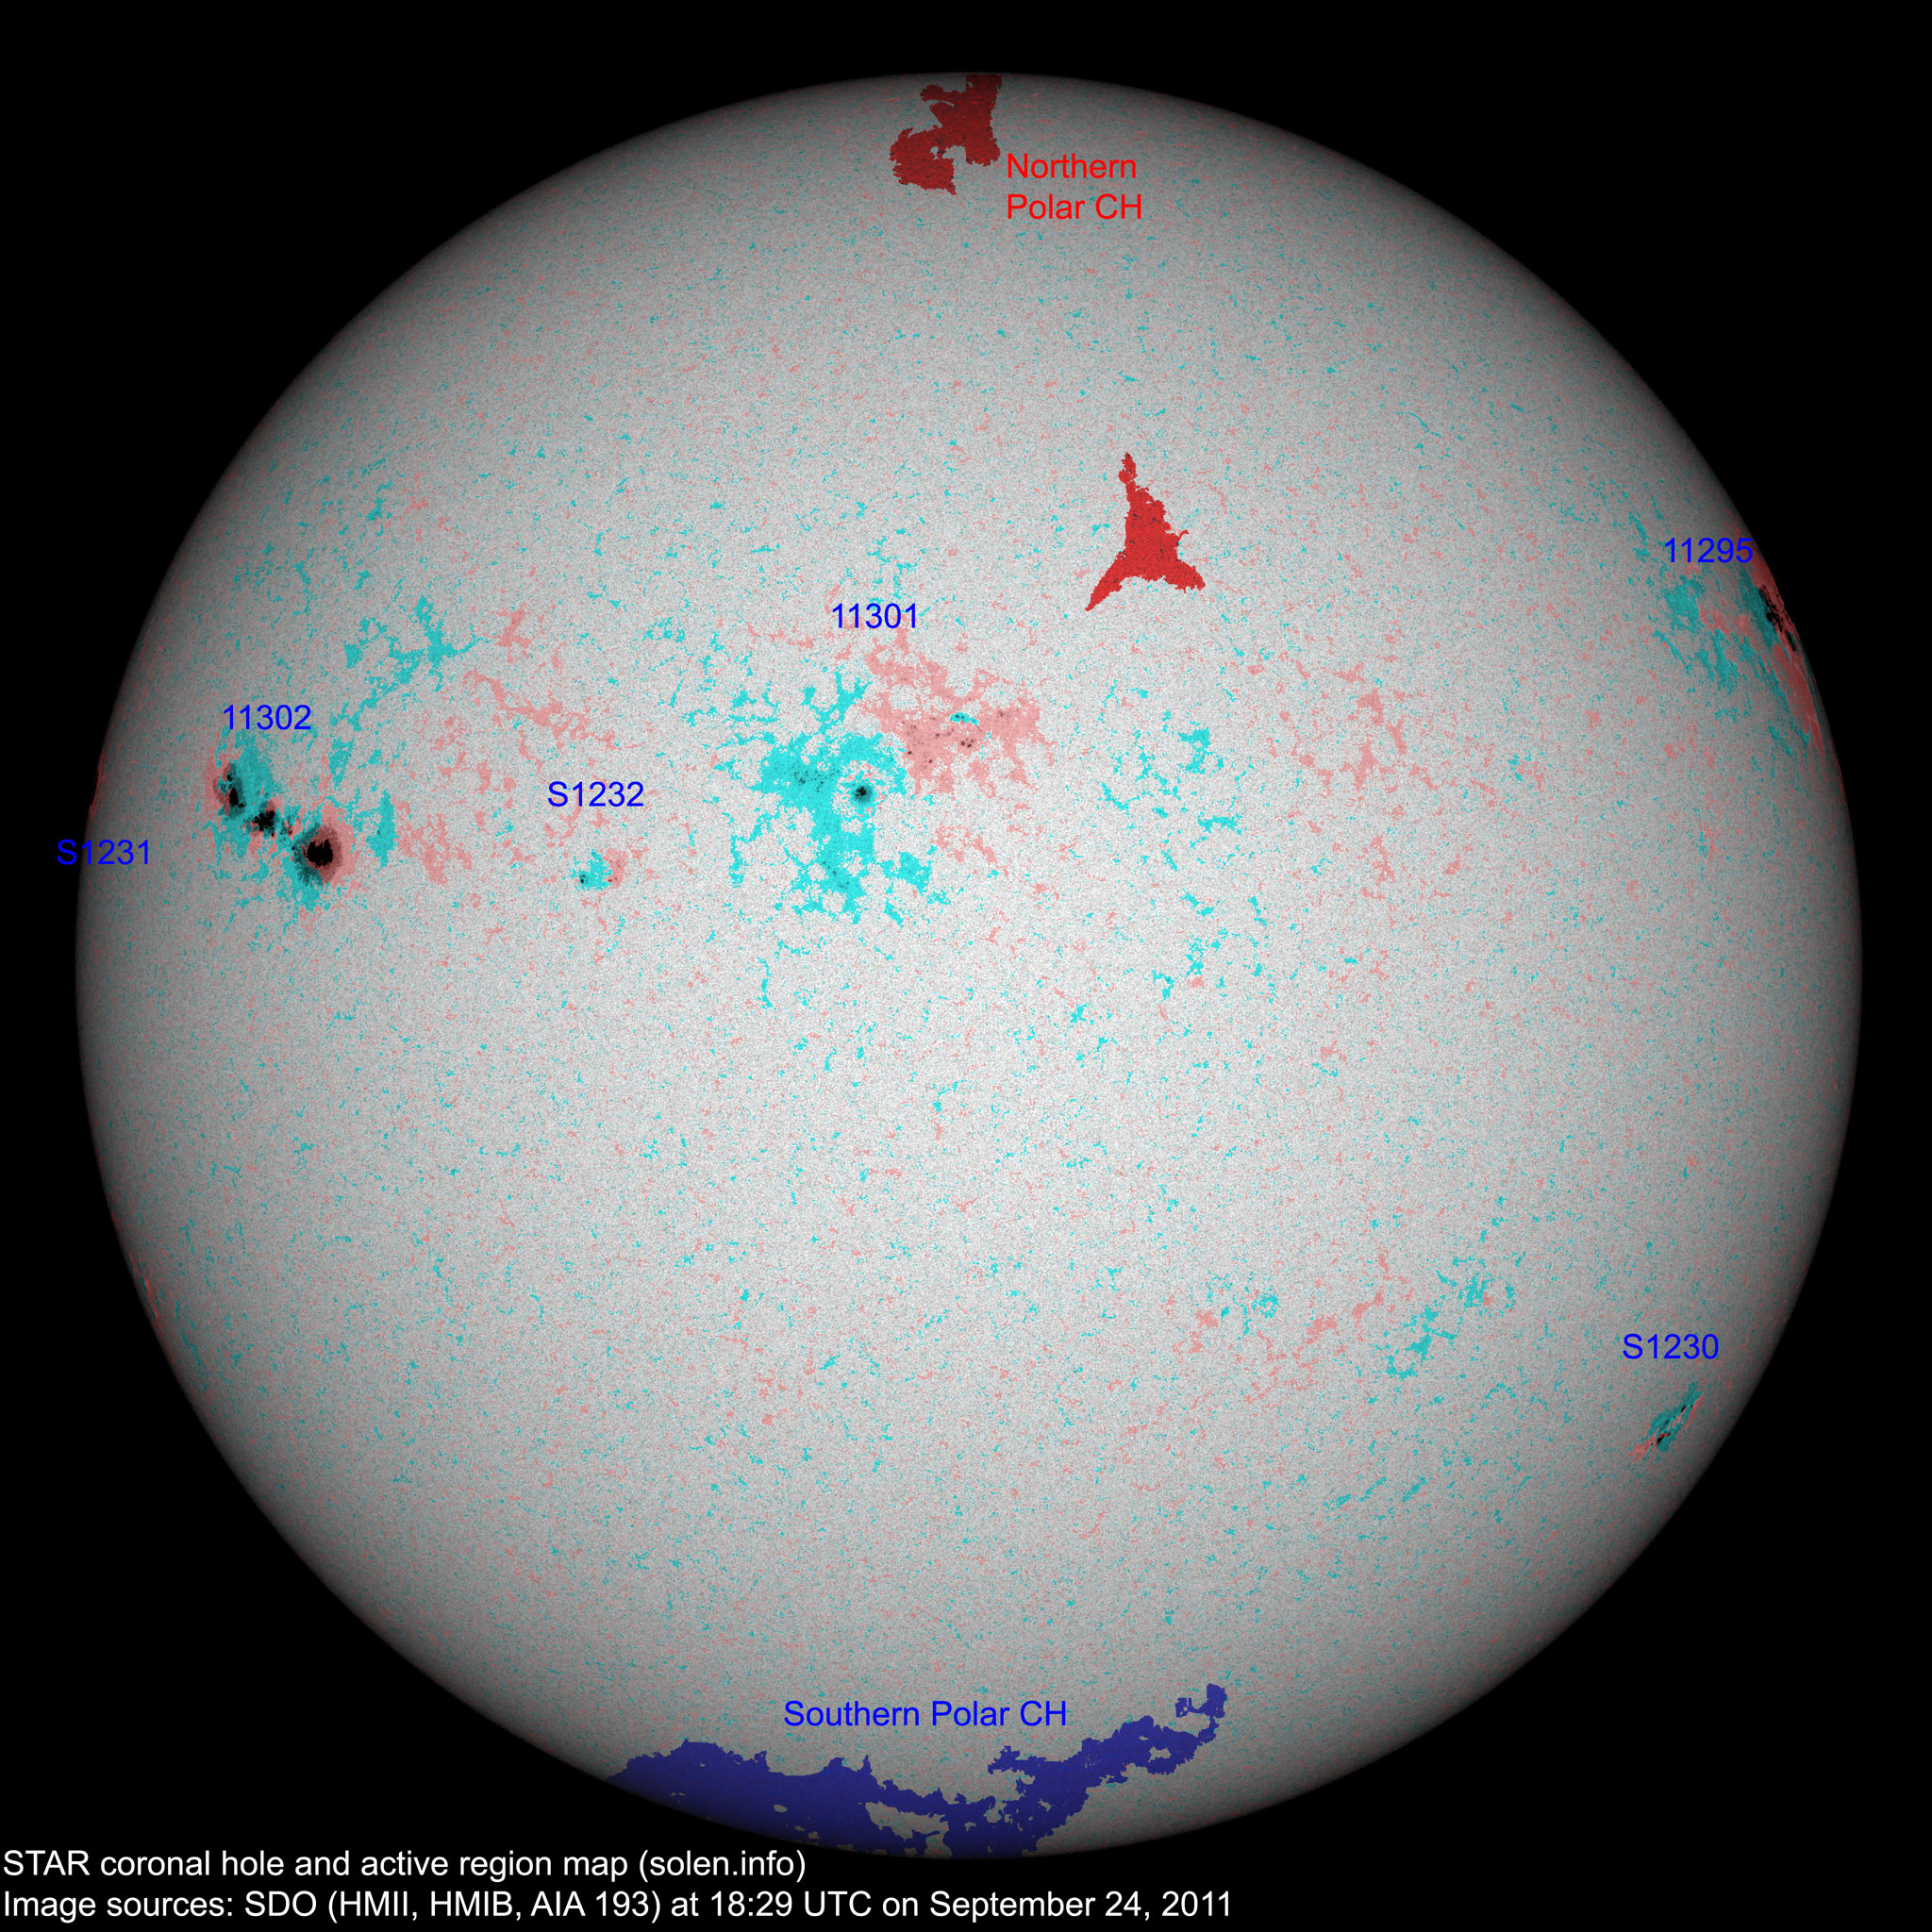
An extension of the southern polar coronal hole rotated across the central meridian on September 21, likely too far to the south to cause geomagnetic effects. Another coronal hole in the northern hemisphere was in an Earth facing position on September 23, probably too far to the north to become geoeffective.

The above coronal hole map is based on a new method where coronal holes are detected automatically. The method may need some fine tuning, however, it has significant advantages over detecting coronal holes manually. The main improvement is the ability to detect coronal holes at and just beyond the solar limbs. Early results using this method for SDO images over a span of several weeks indicate a good match between coronal holes observed over the visible disk and their extent and position at the east and west limbs. Note that the polar coronal holes are easily detected using the new method, the extent and intensity of both holes are consistent with other data sources.
Long distance low and medium frequency (below 2 MHz) propagation along paths north of due west over high and upper middle latitudes is poor to fair. Propagation on long distance northeast-southwest paths is poor to fair.
The geomagnetic field is expected to be mostly quiet on September 24. A CME arrival is possible on September 25 and could cause unsettled to minor storming that day. Quiet to active is likely on September 26.
| Coronal holes (1) | Coronal mass ejections (2) | M and X class flares (3) |
1) Effects from a coronal hole could reach Earth within the
next 5 days. When the high speed stream has arrived the color changes to
green.
2) Effects from a CME are likely to be observed at Earth within 96 hours.
3) There is a possibility of either M or X class flares within the next 48
hours.
Green: 0-20% probability, Yellow: 20-60% probability, Red: 60-100% probability.
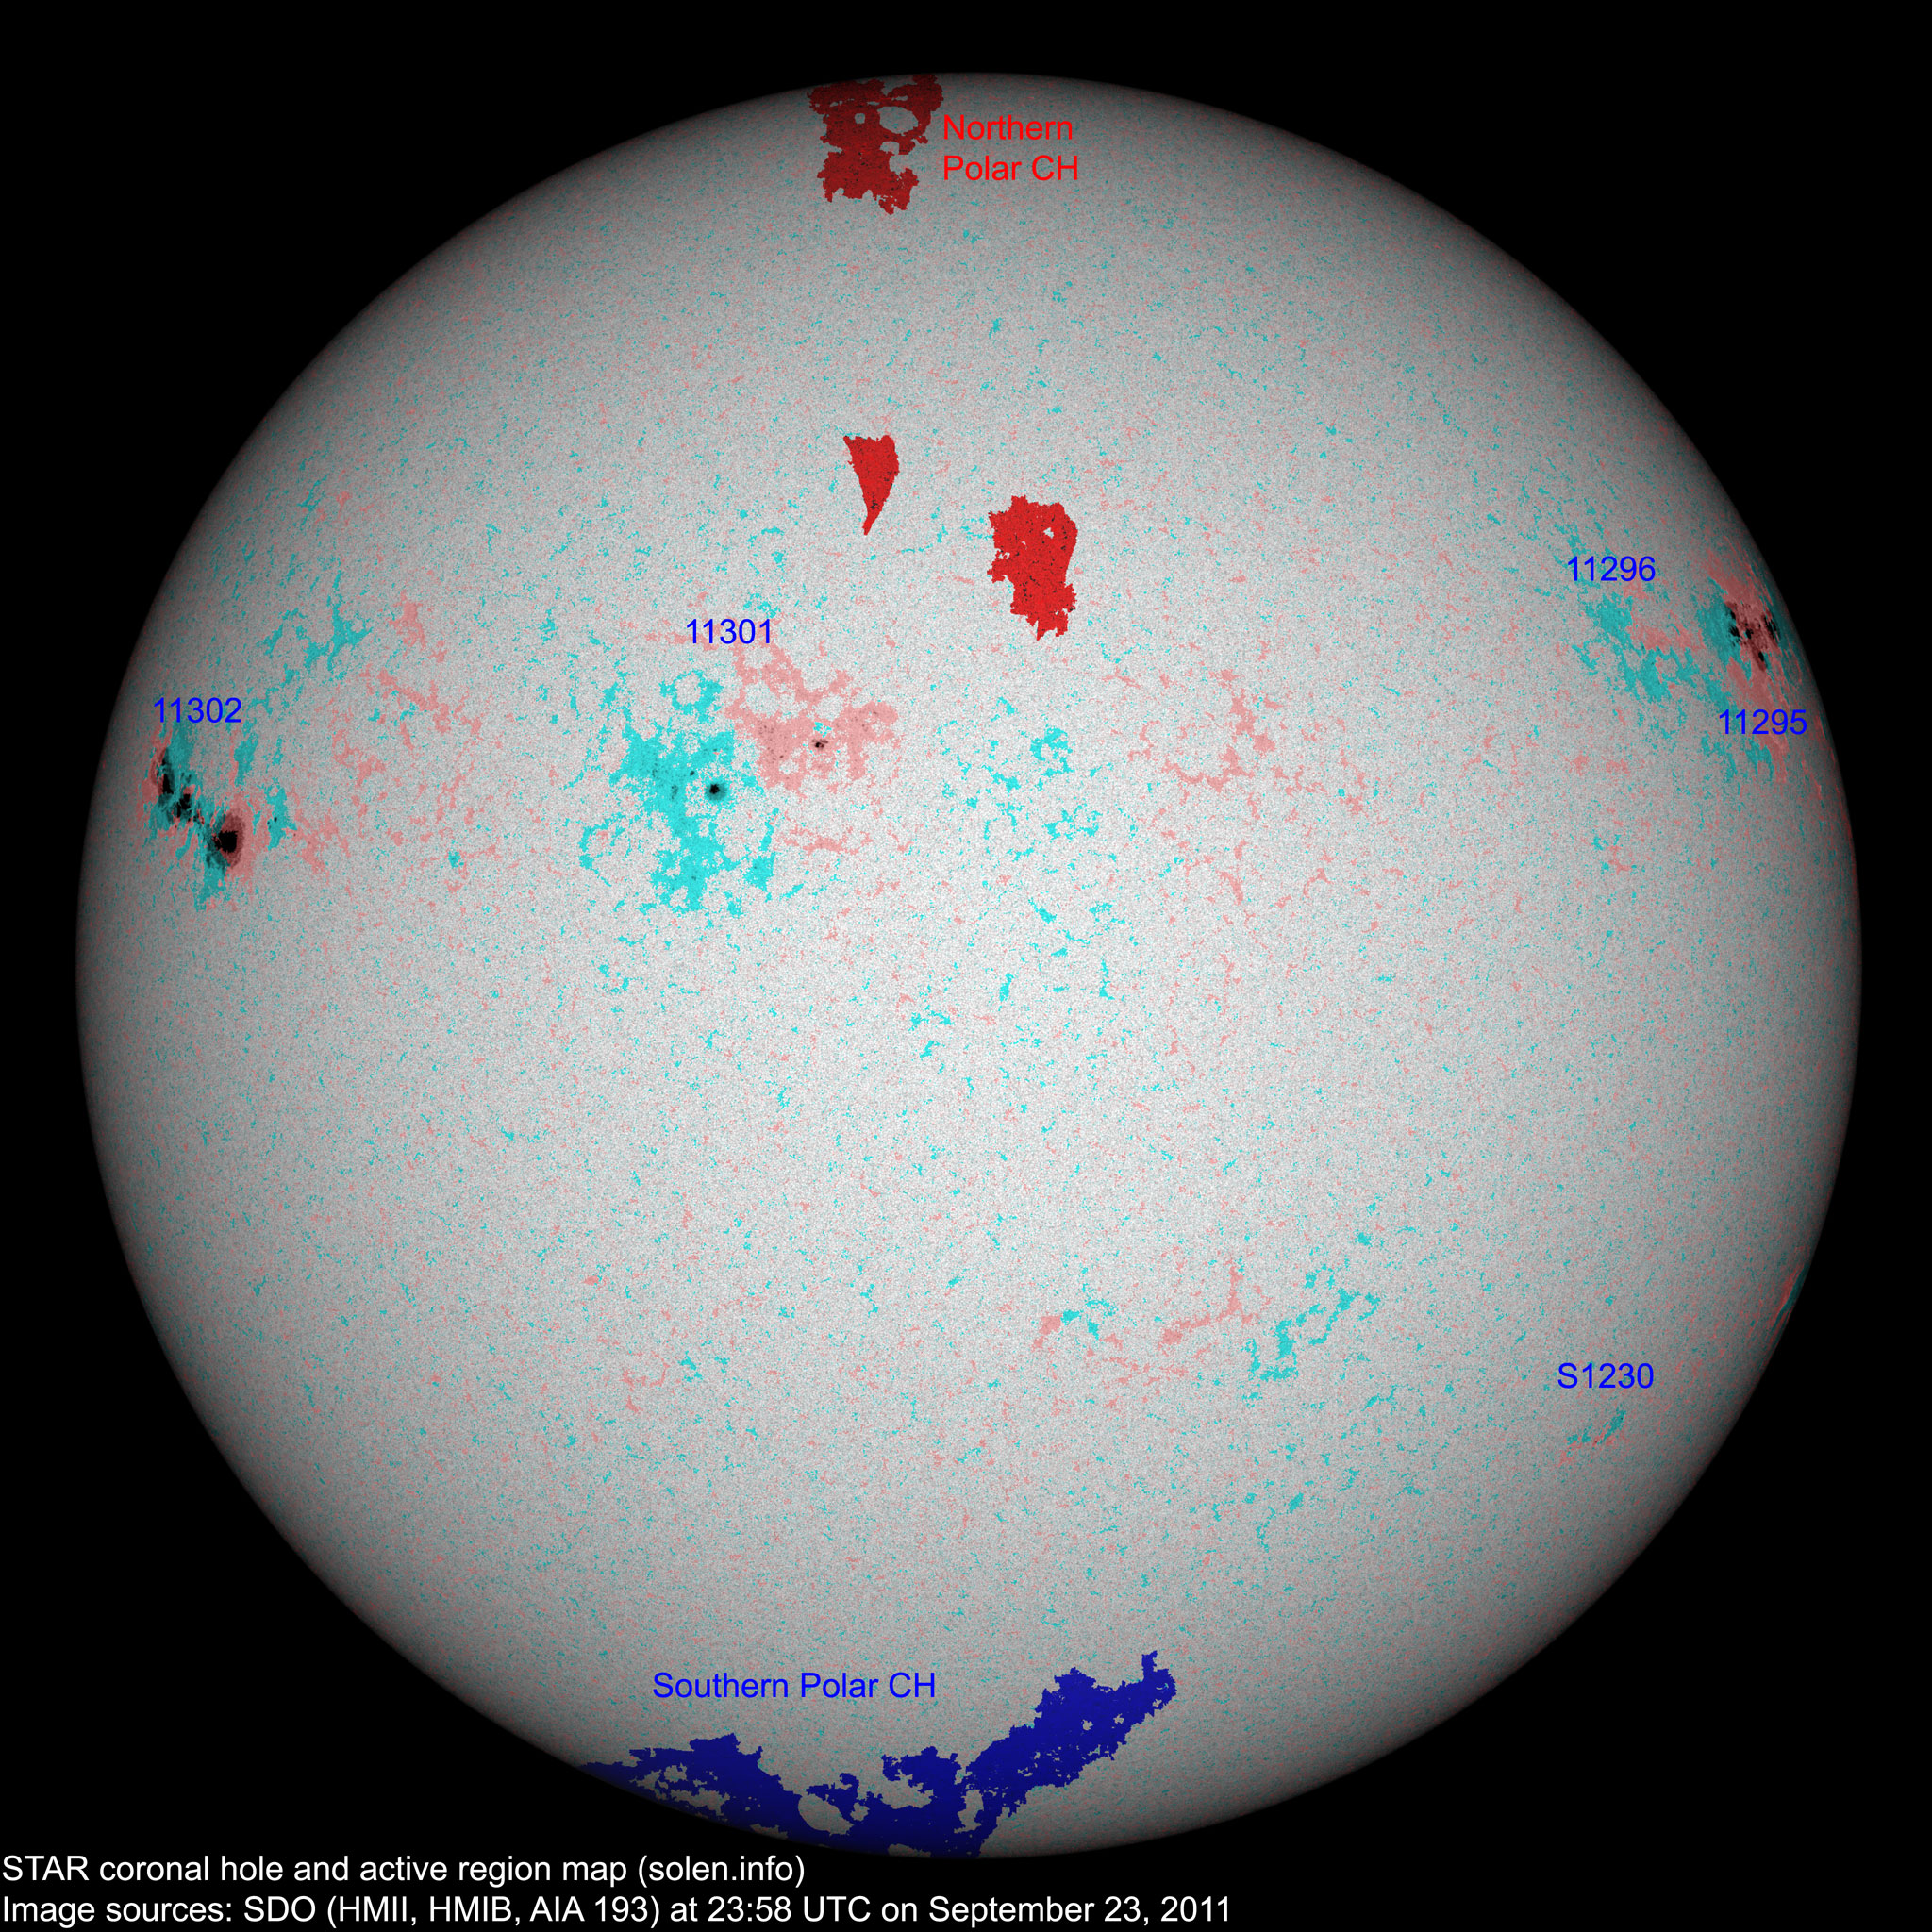
(Click on image for higher resolution image) Compare to the previous day's image
When available the active region map has a coronal hole polarity overlay where red (pink) is negative and blue (blue-green) is positive.
Data for all numbered solar regions according to the Solar Region Summary provided by NOAA/SWPC. Comments are my own, as is the STAR spot count (spots observed at or inside a few hours before midnight) and data for regions not numbered by SWPC or where SWPC has observed no spots. SWPC active region numbers in the table below and in the active region map above are the historic SWPC/USAF numbers.
| Active region | Date numbered detected |
Spot count | Location at midnight | Area | Classification | SDO / HMI 4K continuum image with polarity overlay |
Comment | |||
|---|---|---|---|---|---|---|---|---|---|---|
| SWPC | STAR SDO | SWPC | STAR | Current | Previous | |||||
| 11295 | 2011.09.11 2011.09.12 |
14 | 24 | N24W74 | 0550 | EKC | EKC |
 |
 |
beta-gamma-delta area: 0750 |
| 11296 | 2011.09.12 2011.09.13 |
1 | 5 | N26W56 | 0010 | AXX | AXX |
 |
 |
|
| 11299 | 2011.09.14 2011.09.16 |
1 | S20W81 | 0010 | AXX |
 |
plage | |||
| 11298 | 2011.09.14 | N16W75 | plage | |||||||
| 11301 | 2011.09.17 2011.09.18 |
14 | 33 | N20E13 | 0110 | DSO | DSO |
 |
 |
area: 0070 |
| S1222 | 2011.09.20 | N22W16 | plage | |||||||
| S1223 | 2011.09.20 | S16W07 |
 |
plage | ||||||
| S1224 | 2011.09.20 | N10W15 | plage | |||||||
| S1225 | 2011.09.21 | S15E16 | plage | |||||||
| 11302 | 2011.09.21 2011.09.22 |
10 | 32 | N13E59 | 0840 | EKC | EHC |
 |
 |
beta-gamma-delta location: N13E64 area: 1000 |
| S1227 | 2011.09.21 | N12W46 |
 |
plage | ||||||
| S1228 | 2011.09.21 | S17W18 | plage | |||||||
| S1229 | 2011.09.21 | S08W31 | plage | |||||||
| S1230 | 2011.09.23 | 3 | S27W53 | 0000 | BXO |
 |
||||
| Total spot count: | 40 | 97 | ||||||||
| Sunspot number: | 90 | 147 | (total spot count + 10 * number of spotted regions) | |||||||
| Classification adjusted SN: | 65 | 122 | (Sum of total spot count + classification adjustment for each AR. Classification adjustment: X=0, R=3, A/S=5, H/K=10) | |||||||
| Relative sunspot number (Wolf number): | 54 | 49 | k * (sunspot number). k = 0.6 for SWPC. k = 0.33 for STAR SDO | |||||||
| Month | Average measured solar flux | International sunspot number (SIDC) | Smoothed sunspot number | Average ap (3) |
|---|---|---|---|---|
| 2008.07 | 65.7 (SF minimum) | 0.5 | 2.8 (-0.4) | |
| 2008.12 | 69.2 | 0.8 | 1.7 (-) sunspot minimum |
3.25 |
| 2010.06 | 72.5 | 13.6 | 16.4 (+0.9) | 8.17 / 6.85 |
| 2010.07 | 79.8 | 16.1 | 16.7 (+0.3) | 6.31 / 5.15 |
| 2010.08 | 79.2 | 19.6 | 17.4 (+0.7) | 8.49 / 7.77 |
| 2010.09 | 81.1 | 25.2 | 19.6 (+2.2) | 5.33 / 5.45 |
| 2010.10 | 81.6 | 23.5 | 23.2 (+3.6) | 6.07 / 6.27 |
| 2010.11 | 82.5 | 21.5 | 26.5 (+3.3) | 4.80 / 5.50 |
| 2010.12 | 84.2 | 14.4 | 28.8 (+2.3) | 3.41 / 4.35 |
| 2011.01 | 83.6 | 19.1 | 31.0 (+2.2) | 4.32 / 5.51 |
| 2011.02 | 94.6 | 29.4 | 33.4 (+2.4) | 5.41 / 6.44 |
| 2011.03 | 115.0 | 56.2 | (36.2 predicted, +2.8) | 7.79 / 8.18 |
| 2011.04 | 112.6 | 54.4 | (39.1 predicted, +2.9) | 9.71 / 8.83 |
| 2011.05 | 95.8 | 41.6 | (42.4 predicted, +3.3) | 9.18 / 8.94 |
| 2011.06 | 95.8 | 37.0 | (46.1 predicted, +3.7) | 8.96 |
| 2011.07 | 94.2 | 43.9 | (50.3 predicted, +4.2) | 9.14 |
| 2011.08 | 101.7 | 50.6 | (54.4 predicted, +4.1) | 8.16 |
| 2011.09 | 129.6 (1) | 83.6 (2A) / 109.0 (2B) | (56.7 predicted, +2.3) | (10.44) |
1) Running average based on the daily 20:00 UTC observed solar flux value at
2800 MHz.
2A) Current impact on the monthly sunspot number based on the Boulder
(NOAA/SWPC) sunspot number (accumulated daily sunspots / month days). The
official SIDC international sunspot number is typically 30-50% lower. 2B) Month
average to date.
3) Running average based on the preliminary daily SWPC ap indices.
Values in red are based on the official NGDC
ap indices.
This report has been prepared by Jan Alvestad. It is based on analysis of data from whatever sources are available at the time the report is prepared. All time references are to the UTC day. Comments and suggestions are always welcome.
SDO images are courtesy of NASA/SDO and the AIA, EVE, and HMI science teams.