
Last major update issued on May 29, 2011 at 05:20 UTC. Minor update posted at 15:30 UTC.
[Solar and geomagnetic data - last month (updated
daily)]
[Solar wind and electron fluence charts (updated
daily)
[Solar cycles 21-24 (last update May 1, 2011)]
[Solar cycles 1-20]
[Graphical comparison of cycles 21, 22, 23 and 24 (last
update May 1, 2011)]
[Graphical comparison of cycles 10, 12, 13, 14, 16 and
24 (last update May 1, 2011)]
[Historical solar and geomagnetic data charts 1954-2006
(last update April 5, 2007)]
[Archived reports since January 2003 (last update May
1, 2011)]
[POES auroral activity level charts since October
2009 - updated May 27, 2011]
Annotated geomagnetic activity charts - Carrington rotation
2108 [March-April
2011] - 2109 [April-May
2011]
[Solar polar fields vs solar cycles - updated May 26, 2011]
NEW
The geomagnetic field was quiet to major storm on May 28. Solar wind speed ranged between 444 and 682 km/s under the influence of a high speed stream from CH450.
Solar flux measured at 20h UTC on 2.8 GHz was 100.5 (decreasing 5.6 over the last solar rotation). The planetary A index was 40 (STAR Ap - based on the mean of three hour interval ap indices: 39.6. The mean of one hour ap indices: 41.3). Three hour interval K indices: 43666224 (planetary), 43665224 (Boulder).
The background x-ray flux is at the class B4 level.
At midnight UTC the visible solar disk had 11 spotted regions.
Region 11222 reemerged with a few spots.
Region 11223 decayed slowly and quietly.
Region 11224 developed slowly and was quiet.
Region 11225 was quiet and stable.
Region 11226 developed quickly and was unstable and very active all day.
While the region had a magnetic delta configuration in the trailing penumbra
most of the day, that structure disappeared appeared the M class event. Further
M class flaring is likely. Flares: C1.4 at
00:35, C1.6 at 02:32, C8.3 at 03:31, C1.7 at 06:19, C4.4 at 08:06, C7.7 at
09:01, C5.3 long duration event peaking at 1030, C1.9 at 12:45, C1.4 at 13:15,
C1.0 at 13:40, C1.0 at 15:43, C1.9 at 17:23, C2.2 at 18:46, M1.1 long duration
event peaking at 21:50 UTC.
Spotted regions not numbered by NOAA/SWPC:
[S1030] emerged in the northwest quadrant on May 26, was spotless on
May 27 and reemerged on May 28. Location at midnight: N16W51
[S1033] emerged in the southeast quadrant on May 28. Location at midnight:
S18E35
[S1034] rotated into view at the northeast limb on May 28. Location at
midnight: N16E82
[S1036] rotated into view at the southeast limb on May 28. The region
could produce C flares. Location at midnight: S20E83
[S1037] emerged very close to the center of the visible disk on May 28.
Due to the north-south alignment of the magnetic fields and spots on both sides
of the equator, it is at this time hard to tell if this is a northern or
southern hemisphere region. Location at midnight: N00E02
[S1038] emerged in the northeast quadrant on May 28. Location at midnight:
N30E07.
Minor update added at 15:30 UTC on May 29: Region 11226 produced a long duration M1.4/1F event peaking at 10:38 UTC. This event was associated with a large CME off the east limb. While both STEREO A and B observed this as a full halo CME, the CME apparently didn't even become a partial halo CME in LASCO images. Region 11227 (formerly S1036) has developed in the leading spot section with two penumbrae forming, the easternmost one has a magnetic delta structure.
Solar wind speed became unusually high today, probably due to the arrival of the stream associated with CH451. SOHO/MDI recorded a peak speed of 953 km/sec. Additionally the IMF swung significantly southwards again causing minor to major geomagnetic storming.
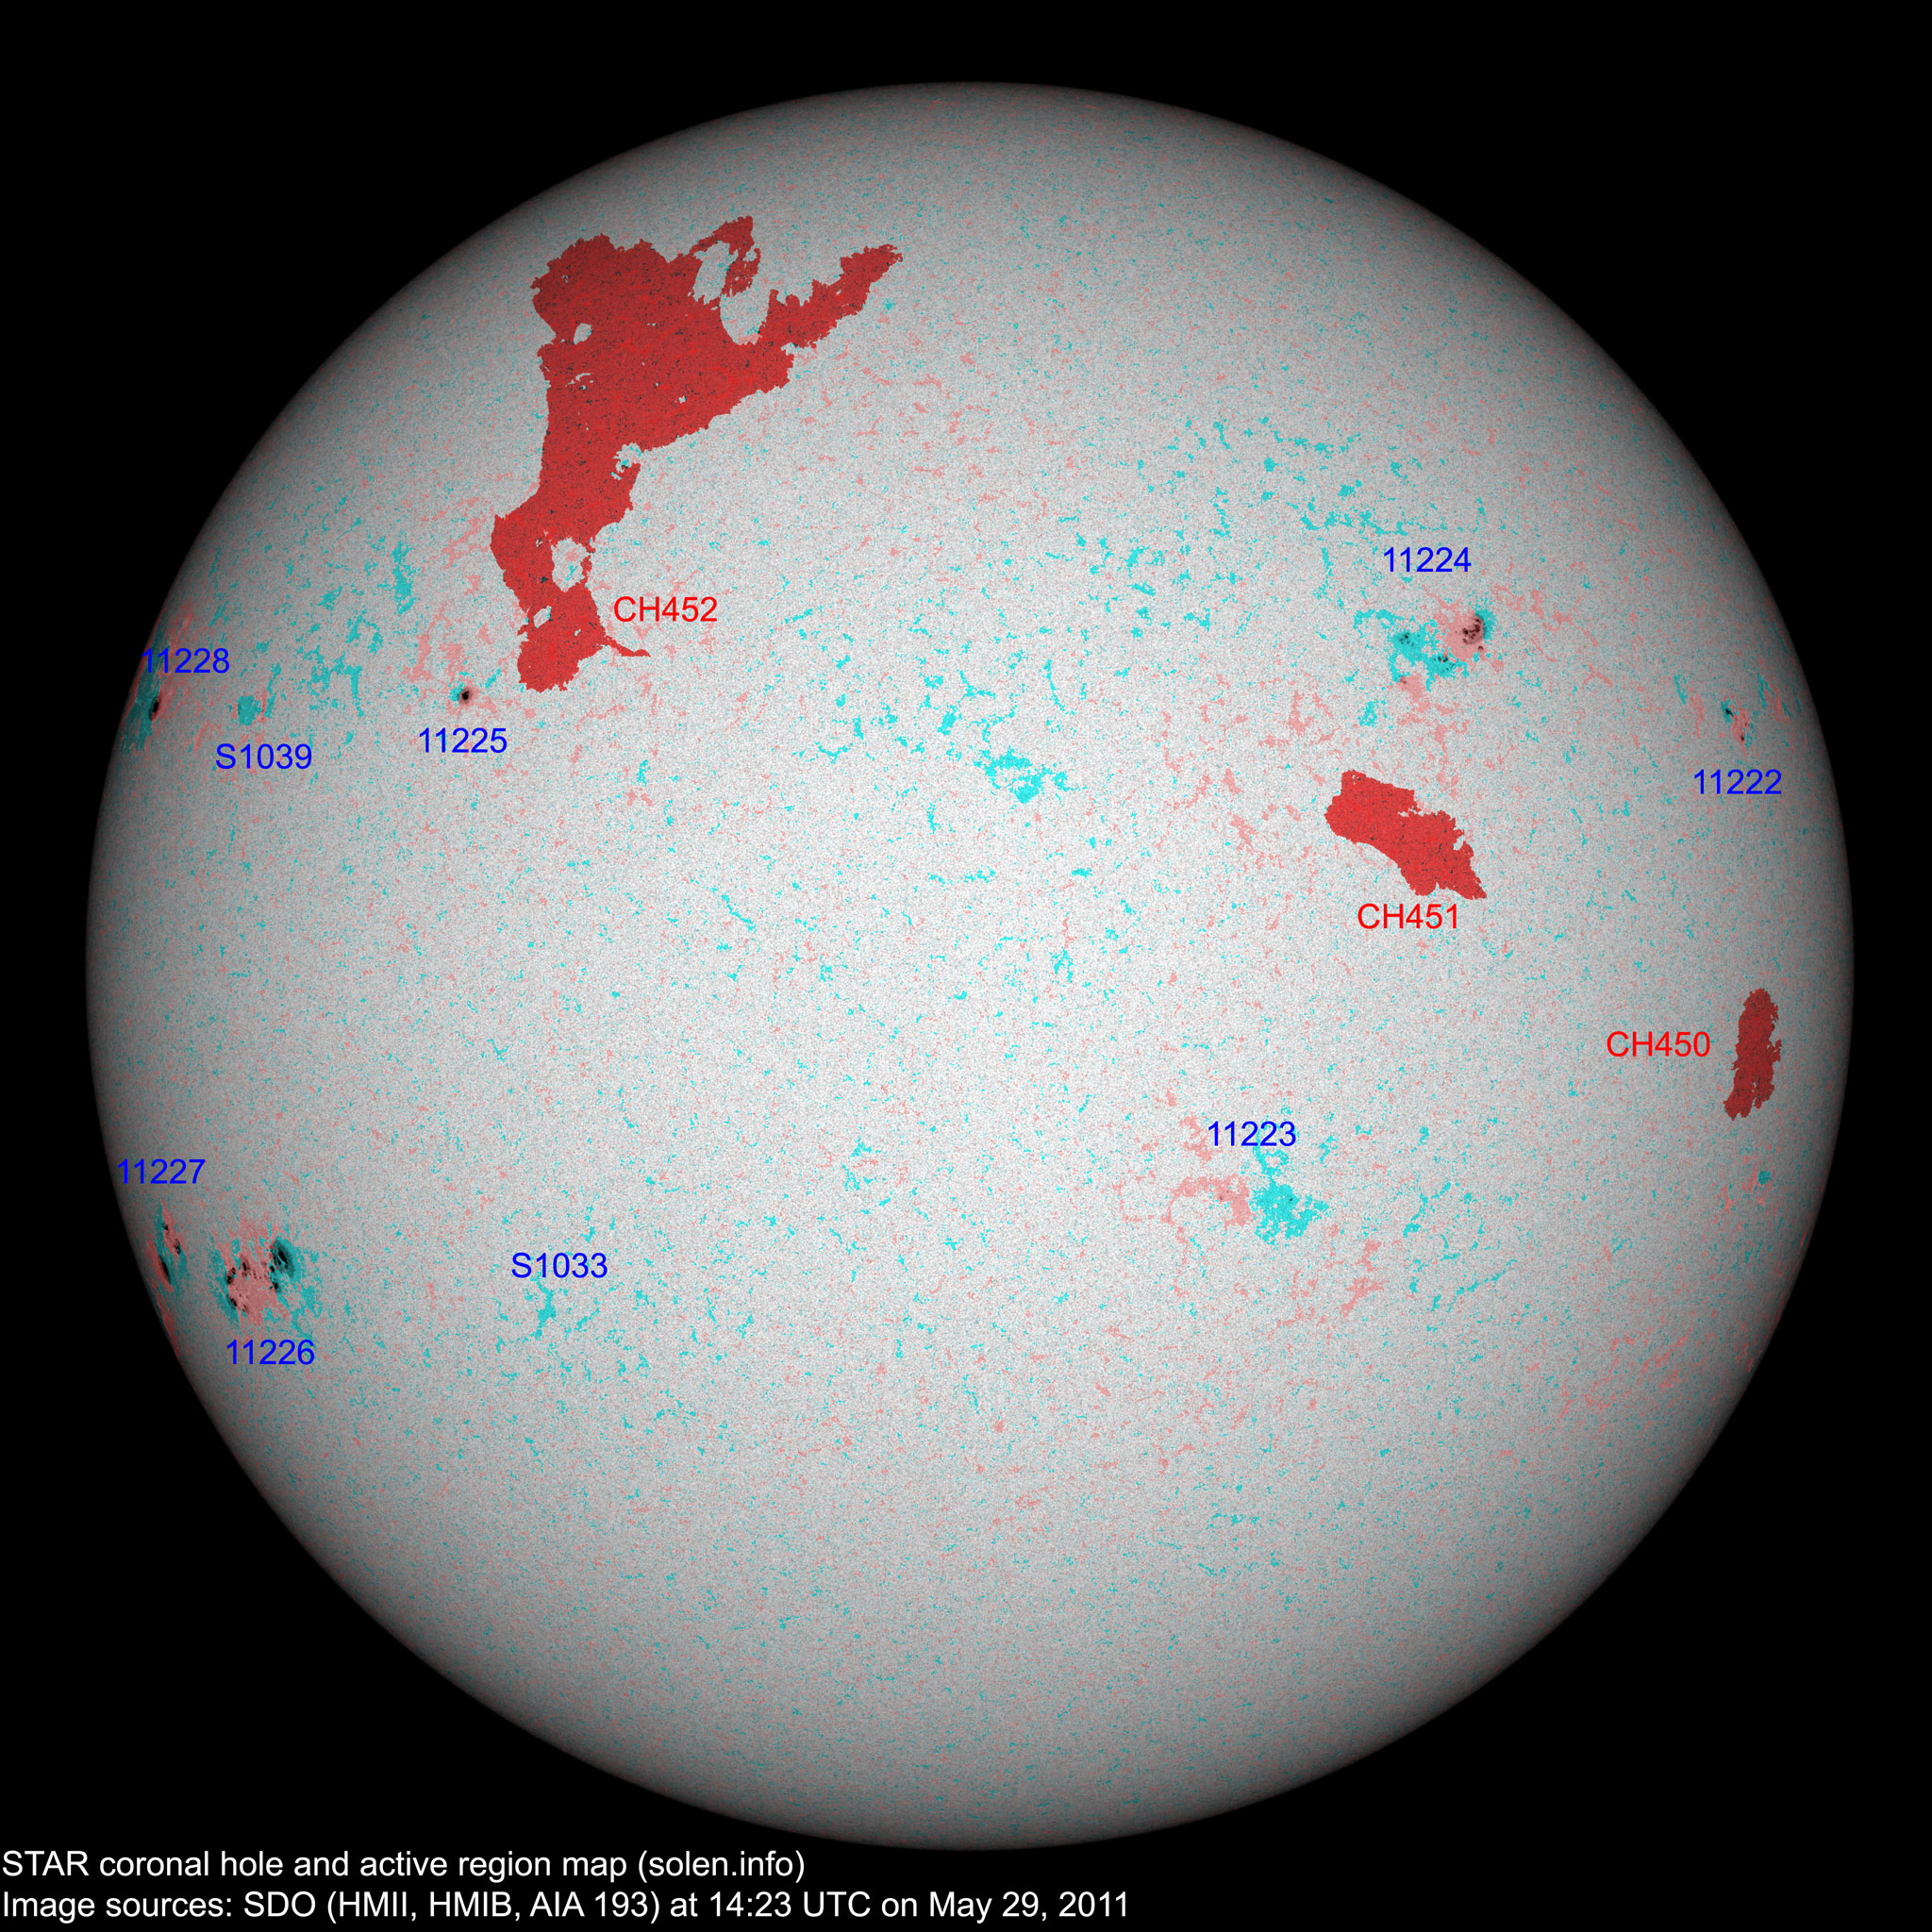
The latest high resolution coronal hole and active region map.
May 26-28: No obviously Earth directed CMEs were observed in LASCO and STEREO imagery.
Coronal hole history (since late October
2002)
Compare today's report to the situation one solar rotation ago:
28 days ago
27 days
ago 26
days ago
A recurrent trans equatorial coronal hole (CH450) was in an Earth facing position on May 24-25. A small coronal hole (CH451) in the northern hemisphere was Earth facing position on May 27-28. The southernmost extension of a large coronal hole (CH452) in the northern hemisphere will likely rotate into an Earth facing position on May 30-31.

The darkest areas on the solar disk are likely coronal holes.
Long distance low and medium frequency (below 2 MHz) propagation along paths north of due west over high and upper middle latitudes is very poor. Propagation on long distance northeast-southwest paths is fair to good.
The geomagnetic field is expected to be quiet to minor storm on May 29 due to effects from CH450. Quiet to active is likely on May 30-31 due to a high speed stream from CH451.
| Coronal holes (1) | Coronal mass ejections (2) | M and X class flares (3) |
1) Effects from a coronal hole could reach Earth within the
next 5 days. When the high speed stream has arrived the color changes to
green.
2) Effects from a CME are likely to be observed at Earth within 96 hours.
3) There is a possibility of either M or X class flares within the next 48
hours.
Green: 0-20% probability, Yellow: 20-60% probability, Red: 60-100% probability.

(Click on image for higher resolution image) Compare to the previous day's image
When available the active region map has a coronal hole polarity overlay where red (pink) is negative and blue (blue-green) is positive.
Data for all numbered solar regions according to the Solar Region Summary provided by NOAA/SWPC. Comments are my own, as is the STAR spot count (spots observed at or inside a few hours before midnight) and data for regions not numbered by SWPC or where SWPC has observed no spots. SWPC active region numbers in the table below and in the active region map above are the historic SWPC/USAF numbers.
| Active region | Date numbered detected |
Spot count | Location at midnight | Area | Classification | SDO / HMI 4K continuum image with polarity overlay |
Comment | |||
|---|---|---|---|---|---|---|---|---|---|---|
| SWPC | STAR SDO | SWPC | STAR | Current | Previous | |||||
| 11216 | 2011.05.15 2011.05.16 |
1 | S16W90 | 0060 | HSX |
 |
rotated out of view | |||
| 11218 | 2011.05.17 2011.05.18 |
S16W70 |
location: S15W58 plage |
|||||||
| 11222 | 2011.05.20 2011.05.25 |
1 | 3 | N16W66 | 0000 | AXX | BXO |
 |
||
| 11219 | 2011.05.21 | N15W27 | location: N15W20 | |||||||
| 11223 | 2011.05.21 2011.05.26 |
5 | 6 | S16W12 | 0020 | BXO | AXX |
 |
 |
location: S16W09 |
| S1024 | 2011.05.24 | N29W24 | plage | |||||||
| S1026 | 2011.05.25 | N10E05 |
 |
plage | ||||||
| 11225 | 2011.05.25 2011.05.27 |
1 | 1 | N17E43 | 0060 | HSX | HSX |
 |
 |
|
| S1028 | 2011.05.25 | S22W19 | plage | |||||||
| 11224 | 2011.05.26 2011.05.27 |
14 | 24 | N20W28 | 0130 | DSO | DSI |
 |
 |
location: N20W26 area: 0180 |
| S1030 | 2011.05.26 | 1 | N16W51 | 0000 | AXX |
 |
||||
| 11226 | 2011.05.27 | 9 | 27 | S19E65 | 0270 | EAI | EAC |
 |
 |
beta-gamma location: S21E79 area: 0380 |
| S1033 | 2011.05.28 | 1 | S18E35 | 0000 | AXX |
 |
||||
| S1034 | 2011.05.28 | 1 | N16E82 | 0100 | HSX |
 |
||||
| S1036 | 2011.05.28 | 4 | S20E83 | 0120 | CSO |
 |
||||
| S1037 | 2011.05.28 | 3 | N00E02 | 0000 | BXO |
 |
||||
| S1038 | 2011.05.28 | 1 | N30E07 | 0000 | AXX |
 |
||||
| Total spot count: | 31 | 72 | ||||||||
| Sunspot number: | 91 | 182 | ||||||||
| Month | Average measured solar flux | International sunspot number (SIDC) | Smoothed sunspot number | Average ap (3) |
|---|---|---|---|---|
| 2008.07 | 65.7 (SF minimum) | 0.5 | 2.8 (-0.4) | |
| 2008.12 | 69.2 | 0.8 | 1.7 (-) sunspot minimum |
3.25 |
| 2010.02 | 84.7 | 18.8 | 10.6 (+1.3) | 4.15 / 4.61 |
| 2010.03 | 83.4 | 15.4 | 12.3 (+1.7) | 4.58 / 4.65 |
| 2010.04 | 75.9 | 8.0 | 14.0 (+1.7) | 10.22 / 10.24 |
| 2010.05 | 73.8 | 8.7 | 15.5 (+1.5) | 9.18 / 8.15 |
| 2010.06 | 72.5 | 13.6 | 16.4 (+0.9) | 8.17 / 6.85 |
| 2010.07 | 79.8 | 16.1 | 16.7 (+0.3) | 6.31 / 5.15 |
| 2010.08 | 79.2 | 19.6 | 17.4 (+0.7) | 8.49 / 7.77 |
| 2010.09 | 81.1 | 25.2 | 19.6 (+2.2) | 5.33 / 5.45 |
| 2010.10 | 81.6 | 23.5 | 23.2 (+3.6) | 6.07 / 6.27 |
| 2010.11 | 82.5 | 21.5 | (26.9 predicted, +3.7) | 4.80 / 5.50 |
| 2010.12 | 84.2 | 14.4 | (30.1 predicted, +3.2) | 3.41 / 4.35 |
| 2011.01 | 83.6 | 19.1 | (33.1 predicted, +3.0) | 4.32 / 5.51 |
| 2011.02 | 94.6 | 29.4 | (35.6 predicted, +2.5) | 5.41 / 6.44 |
| 2011.03 | 115.0 | 56.2 | (37.9 predicted, +2.3) | 7.79 |
| 2011.04 | 112.6 | 54.4 | (40.8 predicted, +2.9) | 9.71 |
| 2011.05 | 94.2 (1) | 50.9 (2A) / 56.4 (2B) | (44.1 predicted, +3.3) | (8.20) |
1) Running average based on the daily 20:00 UTC observed solar flux value at
2800 MHz.
2A) Current impact on the monthly sunspot number based on the Boulder
(NOAA/SWPC) sunspot number (accumulated daily sunspots / month days). The
official SIDC international sunspot number is typically 30-50% lower. 2B) Month
average to date.
3) Running average based on the preliminary daily SWPC ap indices.
Values in red are based on the official NGDC
ap indices.
This report has been prepared by Jan Alvestad. It is based on analysis of data from whatever sources are available at the time the report is prepared. All time references are to the UTC day. Comments and suggestions are always welcome.
SDO images are courtesy of NASA/SDO and the AIA, EVE, and HMI science teams.