
Last major update issued on March 5, 2011 at 07:20 UTC. Minro update posted at 16:05 UTC
[Solar and geomagnetic data - last month (updated daily)]
[Solar wind and electron fluence charts (updated daily)
[Solar cycles 21-24 (last update March 2, 2011)]
[Solar cycles 1-20]
[Graphical comparison of cycles 21, 22, 23 and 24 (last update
March 2, 2011)]
[Graphical comparison of cycles 10, 12, 13, 14, 16 and 24 (last update
March 2, 2011)]
[Historical solar and geomagnetic data charts 1954-2006 (last update April 5, 2007)]
[Archived reports since January 2003 (last update March
1, 2011)]
[POES auroral activity level charts since October
2009 - updated March 4, 2011]
Annotated geomagnetic activity charts - Carrington rotation
2105
[Dec-Jan.2011] - 2106
[Jan.-Feb.2011] NEW
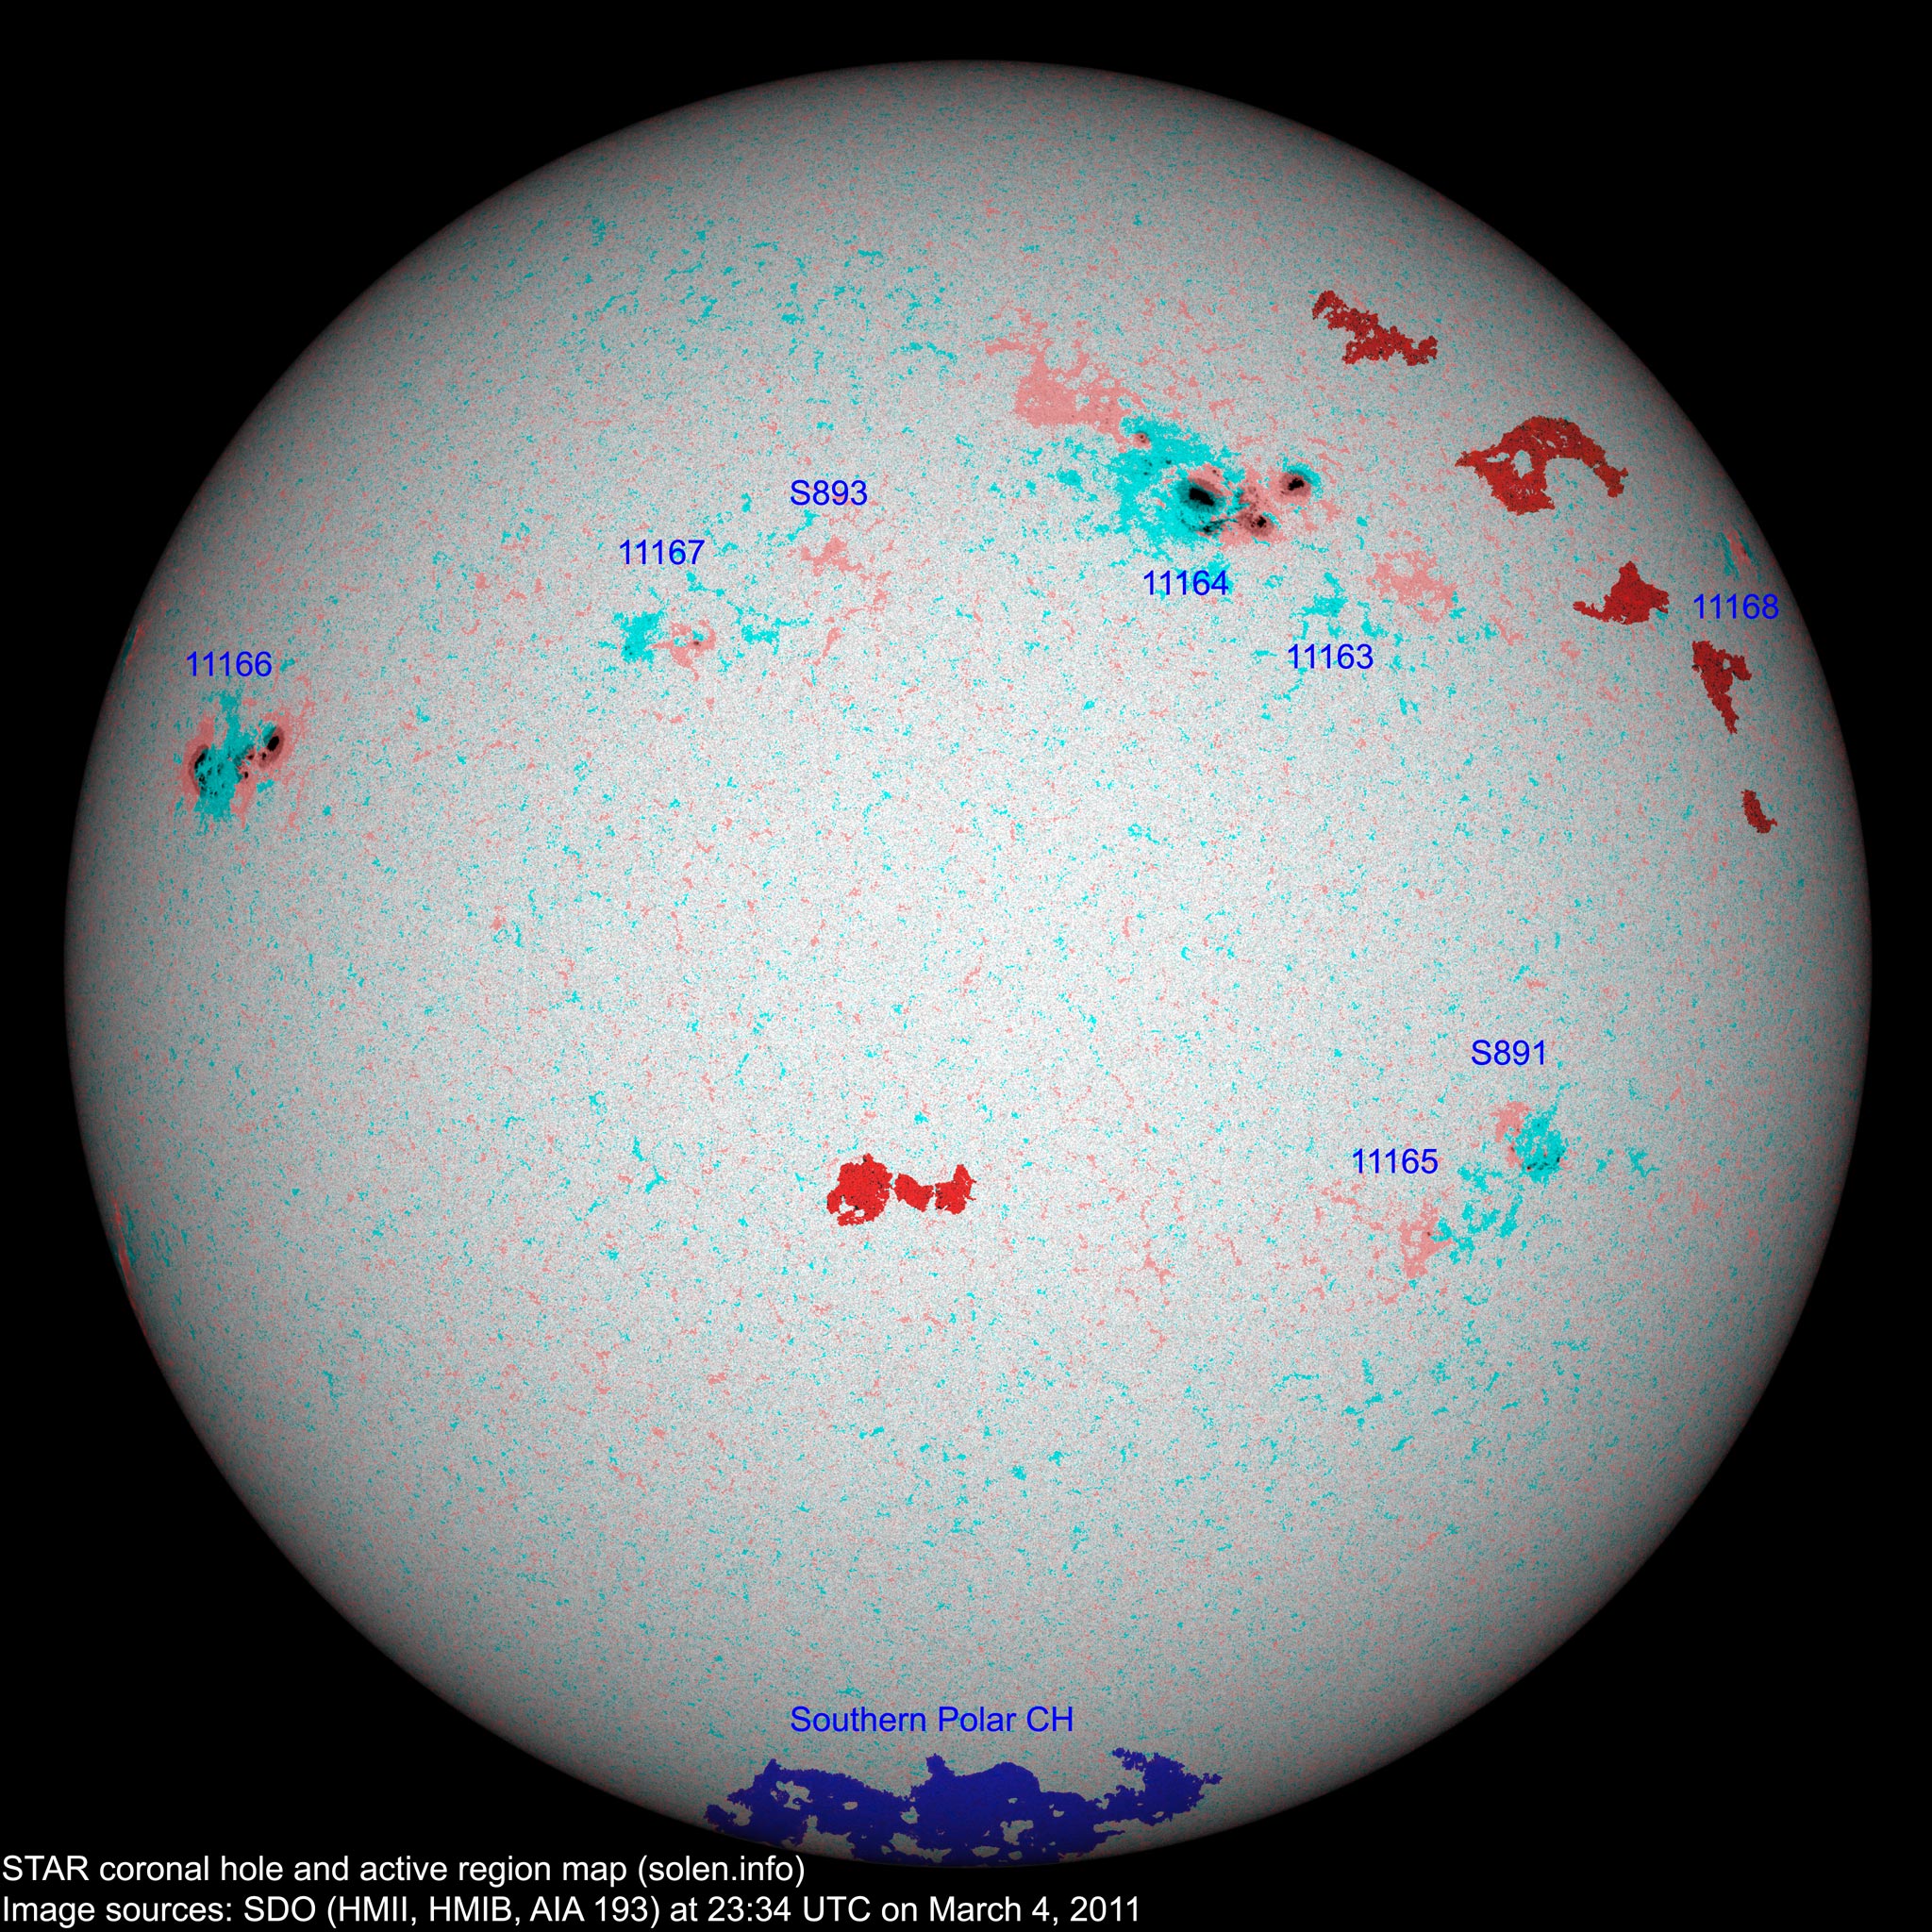
The geomagnetic field was quiet to unsettled on March 4 under the influence of a high speed stream from CH438.
Solar flux measured at 20h UTC on 2.8 GHz was 126.8 (increasing 45.8 over the last solar rotation). The planetary A index was 10 (STAR Ap - based on the mean of three hour interval ap indices: 10.5). Three hour interval K indices: 23322223 (planetary), 23332322 (Boulder).
The background x-ray flux is at the class B7 level.
At midnight UTC the visible solar disk had 8 spotted regions.
Region 11163 was quiet and stable.
Region 11164 developed a weak magnetic delta structure and has major
flare potential. Taking into consideration the complexity of the region, it has
displayed surprisingly little activity.
Flares: C1.7 at 14:00, C1.0 at 17:19 UTC.
Region 11165 was quiet and stable.
Region 11166 developed significantly with a magnetic delta structure
forming in a new and quickly expanding central penumbra. The region is compact
and could produce a major flare.
Region 11167 was quiet and didn't change significantly.
New region 11168 emerged in the northwest quadrant on March 3 and was
numbered the next day by NOAA/SWPC. The region decayed and lost the trailing
spots.
Spotted regions not numbered by NOAA/SWPC:
[S891] This region emerged in the southwest quadrant on March 3. Slow
development was observed on March 4 and the region currently has polarity
intermixing. Location at midnight: S17W41. Unfortunately SWPC seems to regard
S891 and 11165 as a single region, this interpretation is not supported by SDO
data.
[S893] Tiny spots emerged in a plage area in the northeast quadrant on
March 3 with slow decay observed on March 4. Location at midnight: N20E09.
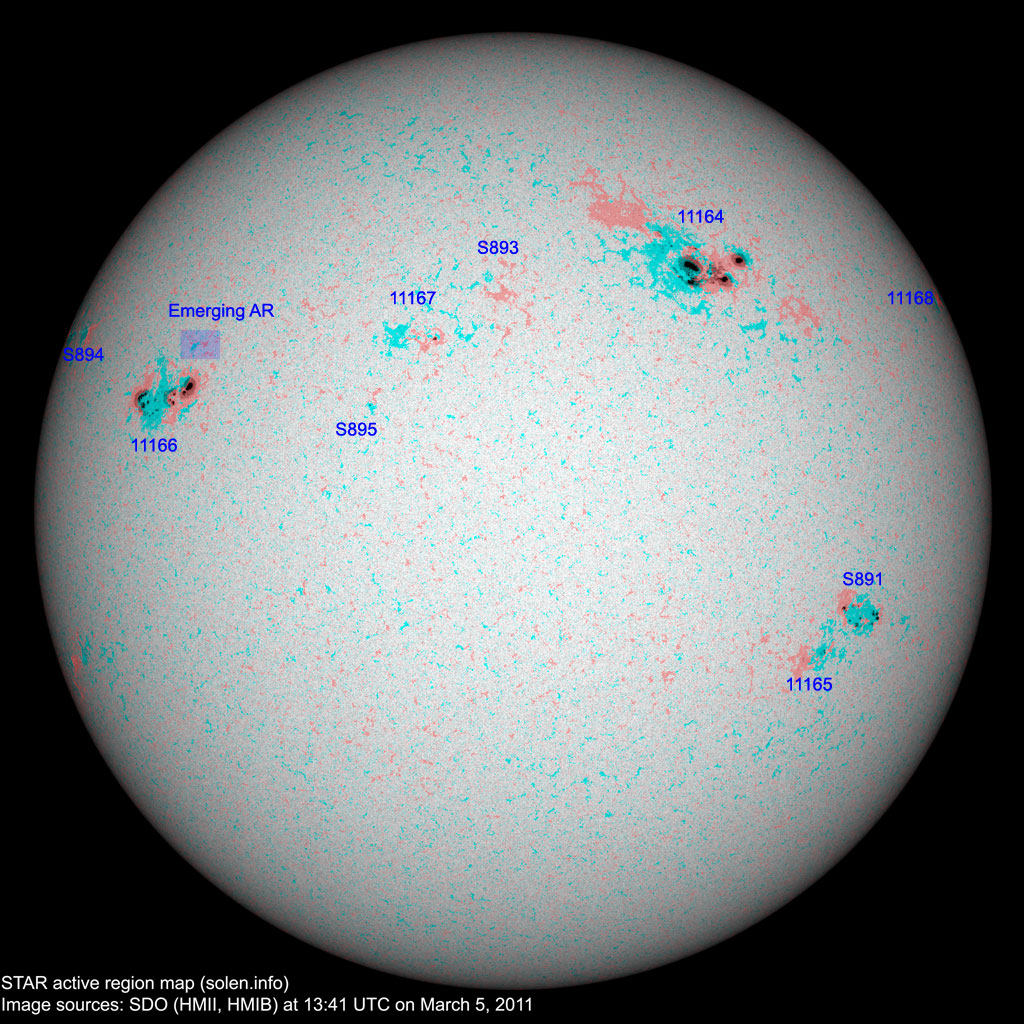
Minor update added at 16:05 UTC: Region 11164 is still developing fairly quickly while region 11166 appears to be less complex now than it was a few hours ago. Here's the latest active region map. A new region (S894) has rotated into view at the northeast limb while spots have emerged in a new region (S895) to the southeast of region 11167. Just north of region 11166 another emerging region is visible and could soon develop spots.
March 2 and 4: No obviously Earth directed CMEs were observed in LASCO and
STEREO imagery.
March 3: A partial halo CME was observed in LASCO and STEREO images after
05:30 UTC. There was no apparent filament eruption and the source of this CME
appears to have been to the southeast of the center of the visible disk.
Coronal hole history (since late October 2002)
Compare today's report to the situation one solar rotation ago:
28 days ago
27 days ago
26 days ago
No significant coronal holes are currently in or near an Earth facing position.

The darkest areas on the solar disk are likely coronal holes.
Long distance low and medium frequency (below 2 MHz) propagation along paths north of due west over high and upper middle latitudes is poor. Propagation on long distance northeast-southwest paths is fair.
The geomagnetic field is expected to be quiet to unsettled on March 5 due to effects from CH438. On March 6 or 7 there is a chance the CME observed on March 3 will cause some unsettled and active intervals, if the CME fails to arrive quiet conditions are likely.
| Coronal holes (1) | Coronal mass ejections (2) | M and X class flares (3) |
1) Effects from a coronal hole could reach Earth
within the next 5 days. When the high speed stream has arrived the
color changes to green.
2) Effects from a CME are likely to be observed at Earth within 96 hours.
3) There is a possibility of either M or X class flares within the next 48 hours.
Green: 0-20% probability, Yellow: 20-60% probability, Red: 60-100% probability.
(Click on image for higher resolution image) Compare to the previous day's image
When available the active region map has a coronal hole polarity overlay where red (pink) is negative and blue (blue-green) is positive.
Data for all numbered solar regions according to the Solar Region Summary provided by NOAA/SWPC. Comments are my own, as is the STAR spot count (spots observed at or inside a few hours before midnight) and data for regions not numbered by SWPC or where SWPC has observed no spots. SWPC active region numbers in the table below and in the active region map above are the historic SWPC/USAF numbers.
| Active region | Date numbered detected |
Spot count | Location at midnight | Area | Classification | SDO / HMI 4K continuum image with polarity overlay |
Comment | |||
|---|---|---|---|---|---|---|---|---|---|---|
| SWPC | STAR SDO | SWPC | STAR | Current | Previous | |||||
| 11163 | 2011.02.24 | 1 | N17W37 | 0000 | AXX |
 |
 |
location: N16W25 | ||
| 11164 | 2011.02.25 | 27 | 57 | N25W19 | 0570 | EKC | FHC |
 |
 |
beta-gamma-delta area: ~0800 |
| 11165 | 2011.02.26 2011.02.25 |
6 | 2 | S19W40 | 0020 | BXO | AXX |
 |
 |
location: S23W34 |
| 11166 | 2011.03.02 | 15 | 35 | N09E55 | 0490 | EAC | EKC |
 |
 |
beta-delta area: ~0700 |
| 11167 | 2011.03.02 2011.03.03 |
5 | 8 | N15E20 | 0020 | BXO | BXO |
 |
 |
|
| S891 | 2011.03.03 | 18 | S17W41 | 0040 | DRI |
 |
 |
beta-gamma | ||
| 11168 | 2011.03.03 2011.03.04 |
1 | 1 | N24W73 | 0000 | AXX |
 |
 |
formerly region S892 | |
| S893 | 2011.03.03 | 1 | N20E09 | 0000 | AXX |
 |
 |
|||
| Total spot count: | 54 | 123 | ||||||||
| Sunspot number: | 104 | 203 | ||||||||
| Month | Average measured solar flux | International sunspot number (SIDC) | Smoothed sunspot number | Average ap (3) |
|---|---|---|---|---|
| 2008.07 | 65.7 (SF minimum) | 0.5 | 2.8 (-0.4) | |
| 2008.12 | 69.2 | 0.8 | 1.7 (-) sunspot minimum |
3.25 |
| 2009.12 | 76.7 | 10.8 | 8.3 (+0.7) | 1.41 / 1.92 |
| 2010.01 | 81.1 | 13.2 | 9.3 (+1.0) | 2.93 / 3.07 |
| 2010.02 | 84.7 | 18.8 | 10.6 (+1.3) | 4.15 / 4.61 |
| 2010.03 | 83.4 | 15.4 | 12.3 (+1.7) | 4.58 / 4.65 |
| 2010.04 | 75.9 | 8.0 | 14.0 (+1.7) | 10.22 / 10.24 |
| 2010.05 | 73.8 | 8.7 | 15.5 (+1.5) | 9.18 / 8.15 |
| 2010.06 | 72.5 | 13.6 | 16.4 (+0.9) | 8.17 / 6.85 |
| 2010.07 | 79.8 | 16.1 | 16.8 (+0.4) | 6.31 / 5.15 |
| 2010.08 | 79.2 | 19.6 | 17.4 (+0.6) | 8.49 / 7.77 |
| 2010.09 | 81.1 | 25.2 | (18.5 predicted, +1.1) | 5.33 / 5.45 |
| 2010.10 | 81.6 | 23.5 | (20.1 predicted, +1.6) | 6.07 / 6.27 |
| 2010.11 | 82.5 | 21.6 | (21.9 predicted, +1.8) | 4.80 / 5.50 |
| 2010.12 | 84.2 | 14.5 | (23.6 predicted, +1.7) | 3.41 / 4.35 |
| 2011.01 | 83.6 | 19.1 | (25.4 predicted, +1.8) | 4.32 |
| 2011.02 | 94.6 | 29.4 | (27.0 predicted, +1.6) | 5.41 |
| 2011.03 | 117.9 (1) | 10.6 (2A) / 82.5 (2B) | (28.9 predicted, +1.9) | (17.63) |
1) Running average based on the
daily 20:00 UTC observed solar flux
value at 2800 MHz.
2A) Current impact on the monthly sunspot number based on the Boulder (NOAA/SWPC) sunspot number
(accumulated daily sunspots / month days). The official SIDC international sunspot number is typically
30-50% lower. 2B) Month average to date.
3) Running average based on the preliminary
daily SWPC ap indices. Values in red are based on
the
official NGDC ap indices.
This report has been prepared by Jan Alvestad. It is based on analysis of data from whatever sources are available at the time the report is prepared. All time references are to the UTC day. Comments and suggestions are always welcome.
SDO images are courtesy of NASA/SDO and the AIA, EVE, and HMI science teams.