
Last major update issued on June 7, 2011 at 04:55 UTC. Last minor update posted at 17:45 UTC.
[Solar and geomagnetic data - last month (updated
daily)]
[Solar wind and electron fluence charts (updated
daily)
[Solar cycles 21-24 (last update June 1, 2011)]
[Solar cycles 1-20]
[Graphical comparison of cycles 21, 22, 23 and 24 (last
update June 1, 2011)]
[Graphical comparison of cycles 10, 12, 13, 14, 16 and
24 (last update June 1, 2011)]
[Historical solar and geomagnetic data charts 1954-2006
(last update April 5, 2007)]
[Archived reports since January 2003 (last update June
1, 2011)]
[POES auroral activity level charts since October
2009 - updated June 1, 2011]
Annotated geomagnetic activity charts - Carrington rotation 2108 [March-April 2011]
- 2109 [April-May
2011]
[Solar polar fields vs solar cycles - updated
May 26, 2011] NEW
The geomagnetic field was quiet to unsettled on June 6. Solar wind speed ranged between 444 and 496 km/s.
Solar flux measured at 20h UTC on 2.8 GHz was 100.2 (increasing 2.7 over the last solar rotation). The planetary A index was 7 (STAR Ap - based on the mean of three hour interval ap indices: 7.3). Three hour interval K indices: 32212122 (planetary), 22312211 (Boulder).
The background x-ray flux is at the class B2 level.
At midnight UTC the visible solar disk had 9 spotted regions.
Region 11226 decayed further and lost all trailing polarity penumbra.
Flares: C1.2 at 01:35 and C1.0 at 09:50
UTC.
Region 11227 decayed slowly and quietly.
Region11228 was quiet and stable.
Region 11230 was quiet and stable.
Region 11232 decayed and was quiet.
Region 11233 decayed slowly and could soon become spotless.
Spotted regions not numbered by NOAA/SWPC:
[S1046] reemerged with tiny spots on June 5. Location at midnight:
N17W04
[S1048] emerged in the northeast quadrant on June 6 with a tiny spot.
Location at midnight: N22E29
[S1049] emerged in the southeast quadrant on June 6. Location at
midnight: S18E21
While none of the regions on the visible disk are very interesting, what was region 11222 appears to have developed into a spectacular region on the backside. On June 4 it produced one of the brightest CMEs of cycle 24 and STEREO imagery indicates frequent flaring and a very hot region. 12222 will not return into view until June 13.
Minor update added at 07:35 UTC on June 7: Region 11226 produced a minor M2.5 proton flare at 06:41 UTC. The event was likely associated with a large and fast CME judging by the earliest images after the event. Although 11226 is approaching the southwest limb, the CME could be partially Earth directed and reach us on June 9. A more detailed CME forecast will be posted later today if the CME is likely to cause a major disturbance.
Minor update added at 15:20 UTC: The full
halo CME observed this morning will likely reach Earth sometime between noon on
June 9 and the afternoon of June 10. Unsettled to major storm conditions are
possible for 12-24 hours after the disturbance begins.
Both the above 10 and 50 MeV proton fluxes reached event threshold before noon
today.
The CME associated with M2.5 event was spectacular in SDO images. Some of the dark ejecta at the outer edges of the CME failed to escape and fell back over a large area of the solar disk. I recommend watching this movie if you have a high bandwith connection.
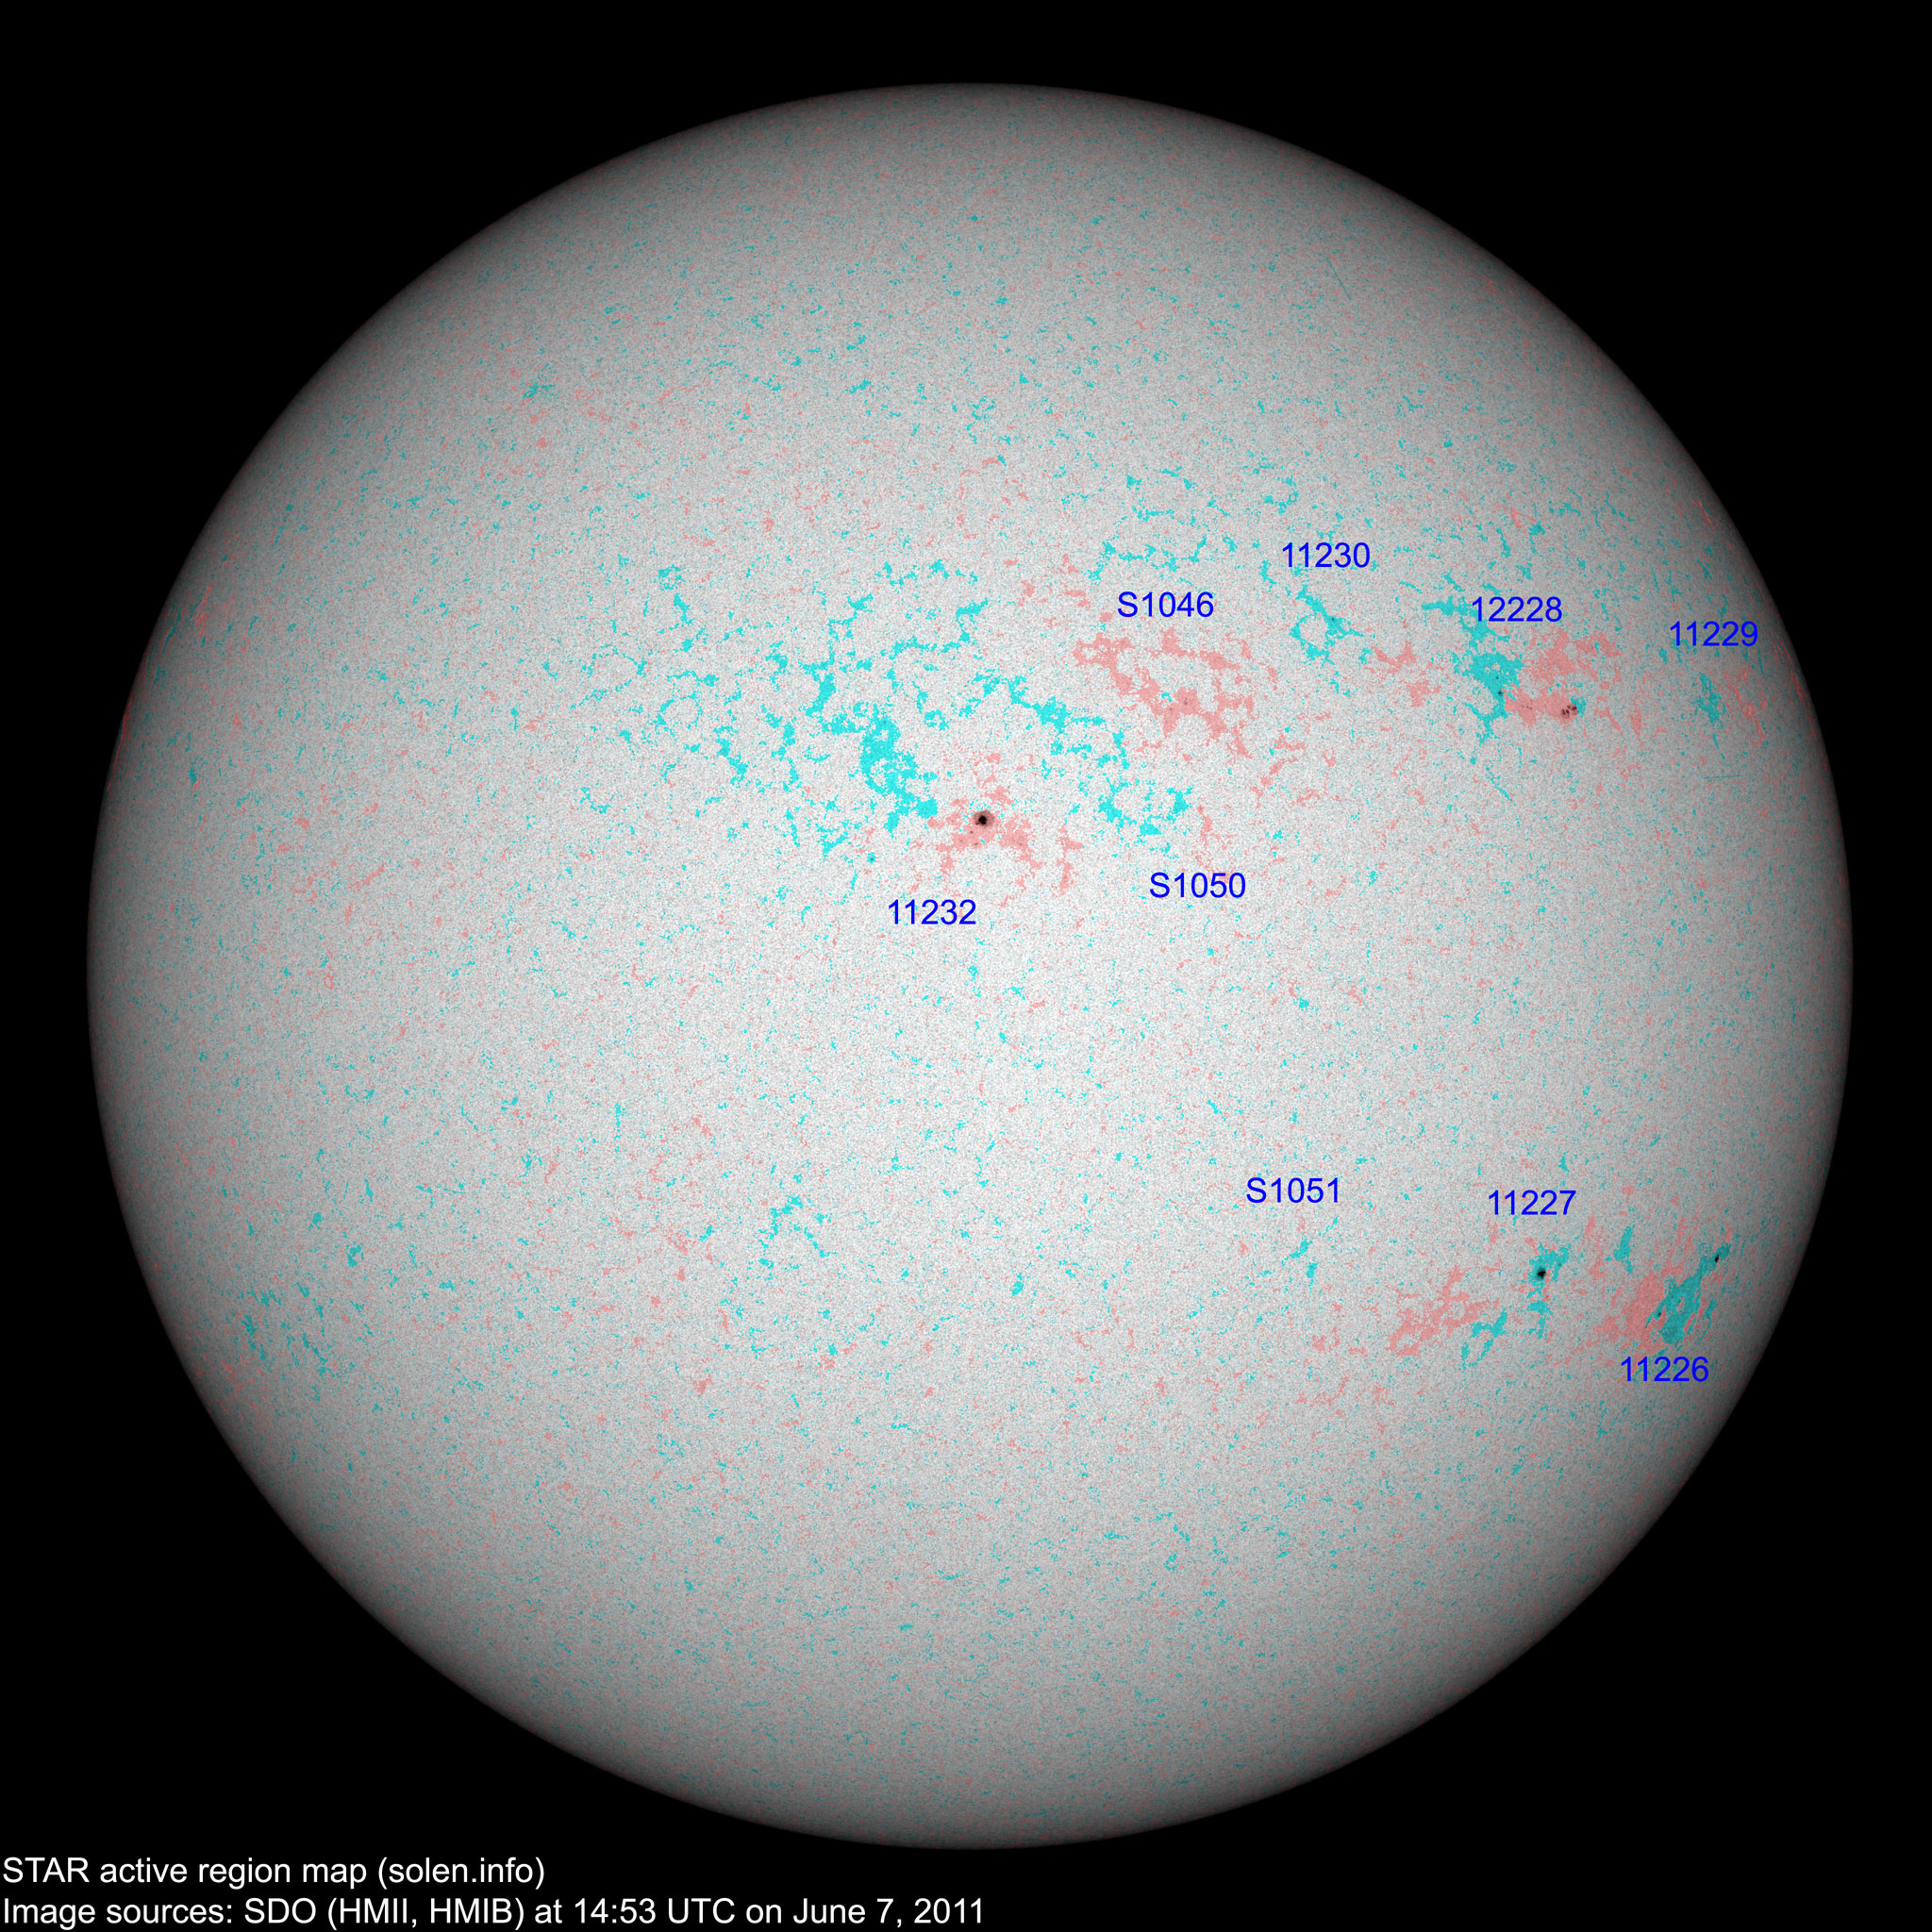
Minor update posted at 16:25 UTC: The newest coronal hole map and high resolution active region map. Notice in the latter image that the M2.5 event today blew away nearly all spots in region 11226 with the slightly complex polarity situation near the main penumbra disappearing.
Minor update posted at 17:45 UTC: ACE solar wind parameters indicate that a high speed stream, likely from CH453, arrived at approximately 16h UTC and could cause unsettled to active geomagnetic conditions.
June 4-6: No obviously earth directed CMEs were observed.
Coronal hole history (since late October
2002)
Compare today's report to the situation one solar rotation ago: 28 days ago 27 days ago 26 days ago
A poorly defined weak coronal area or coronal hole (CH453) across the equator between regions S1044 and 11228 was Earth facing on June 4.
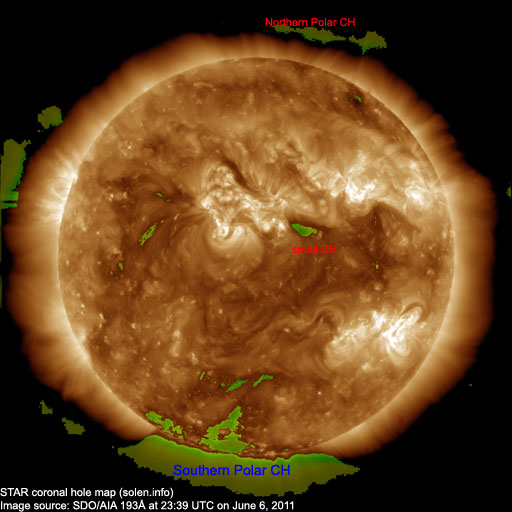
The above coronal hole map is based on a new method where coronal holes are detected automatically. The method may need some fine tuning, however, it has significant advantages over detecting coronal holes manually. The main improvement is the ability to detect coronal holes at and just beyond the solar limbs. Early results using this method for SDO images over a span of several weeks indicate a good match between coronal holes observed over the visible disk and their extent and position at the east and west limbs. Note that the polar coronal holes are easily detected using the new method, the extent and intensity of both holes are consistent with other data sources.
Long distance low and medium frequency (below 2 MHz) propagation along paths north of due west over high and upper middle latitudes is poor. Propagation on long distance northeast-southwest paths is poor to fair.
The geomagnetic field is expected to be mostly quiet on June 7-9. On June 7 effects from CH453 could arrive and cause some unsettled intervals.
| Coronal holes (1) | Coronal mass ejections (2) | M and X class flares (3) |
1) Effects from a coronal hole could reach Earth within the
next 5 days. When the high speed stream has arrived the color changes to
green.
2) Effects from a CME are likely to be observed at Earth within 96 hours.
3) There is a possibility of either M or X class flares within the next 48
hours.
Green: 0-20% probability, Yellow: 20-60% probability, Red: 60-100% probability.

(Click on image for higher resolution image) Compare to the previous day's image
When available the active region map has a coronal hole polarity overlay where red (pink) is negative and blue (blue-green) is positive.
Data for all numbered solar regions according to the Solar Region Summary provided by NOAA/SWPC. Comments are my own, as is the STAR spot count (spots observed at or inside a few hours before midnight) and data for regions not numbered by SWPC or where SWPC has observed no spots. SWPC active region numbers in the table below and in the active region map above are the historic SWPC/USAF numbers.
| Active region | Date numbered detected |
Spot count | Location at midnight | Area | Classification | SDO / HMI 4K continuum image with polarity overlay |
Comment | |||
|---|---|---|---|---|---|---|---|---|---|---|
| SWPC | STAR SDO | SWPC | STAR | Current | Previous | |||||
| 11225 | 2011.05.25 2011.05.27 |
N17W77 |  |
location: N15W74
plage |
||||||
| 11226 | 2011.05.27 | 8 | 13 | S22W52 | 0080 | DAO | CAO |  |
 |
|
| 11228 | 2011.05.28 2011.05.29 |
4 | 13 | N18W35 | 0070 | CSO | CSO |  |
 |
location: N16W33 |
| 11227 | 2011.05.28 2011.05.29 |
1 | 3 | S21W35 | 0030 | HSX | CSO |  |
 |
location: S22W33
|
| 11229 | 2011.05.29 2011.05.30 |
N18W62 |  |
location: N16W54
plage |
||||||
| 11230 | 2011.05.30 2011.05.31 |
1 | N20W22 | 0000 | AXX |  |
 |
location: N22W17 |
||
| 11232 | 2011.05.31 2011.06.01 |
3 | 8 | N08E07 | 0040 | CSO | CSO |  |
 |
|
| 11231 | 2011.06.01 2011.06.02 |
N09W08 |  |
location: N08W02 plage |
||||||
| 12233 | 2011.06.01 | 1 | 1 | S18W43 | 0000 | AXX | AXX |  |
 |
|
| S1046 | 2011.06.03 | 6 | N17W04 | 0000 | BXO |  |
 |
|||
| S1047 | 2011.06.04 | S26E26 | plage | |||||||
| S1048 | 2011.06.06 | 1 | N22E29 | 0000 | AXX |  |
||||
| S1049 | 2011.06.06 | 1 | S18E21 | 0000 | AXX |  |
||||
| Total spot count: | 17 | 47 | ||||||||
| Sunspot number: | 67 | 137 | ||||||||
| Month | Average measured solar flux | International sunspot number (SIDC) | Smoothed sunspot number | Average ap (3) |
|---|---|---|---|---|
| 2008.07 | 65.7 (SF minimum) | 0.5 | 2.8 (-0.4) | |
| 2008.12 | 69.2 | 0.8 | 1.7 (-) sunspot minimum |
3.25 |
| 2010.02 | 84.7 | 18.8 | 10.6 (+1.3) | 4.15 / 4.61 |
| 2010.03 | 83.4 | 15.4 | 12.3 (+1.7) | 4.58 / 4.65 |
| 2010.04 | 75.9 | 8.0 | 14.0 (+1.7) | 10.22 / 10.24 |
| 2010.05 | 73.8 | 8.7 | 15.5 (+1.5) | 9.18 / 8.15 |
| 2010.06 | 72.5 | 13.6 | 16.4 (+0.9) | 8.17 / 6.85 |
| 2010.07 | 79.8 | 16.1 | 16.7 (+0.3) | 6.31 / 5.15 |
| 2010.08 | 79.2 | 19.6 | 17.4 (+0.7) | 8.49 / 7.77 |
| 2010.09 | 81.1 | 25.2 | 19.6 (+2.2) | 5.33 / 5.45 |
| 2010.10 | 81.6 | 23.5 | 23.2 (+3.6) | 6.07 / 6.27 |
| 2010.11 | 82.5 | 21.5 | 26.5 (+3.3) | 4.80 / 5.50 |
| 2010.12 | 84.2 | 14.4 | (29.4 predicted, +2.9) | 3.41 / 4.35 |
| 2011.01 | 83.6 | 19.1 | (32.6 predicted, +3.2) | 4.32 / 5.51 |
| 2011.02 | 94.6 | 29.4 | (35.2 predicted, +2.6) | 5.41 / 6.44 |
| 2011.03 | 115.0 | 56.2 | (37.5 predicted, +2.3) | 7.79 |
| 2011.04 | 112.6 | 54.4 | (40.4 predicted, +2.9) | 9.71 |
| 2011.05 | 95.8 | 41.6 | (43.7 predicted, +3.3) | 9.18 |
| 2011.06 | 106.4 (1) | 20.2 (2A) / 101.0 (2B) | (47.4 predicted, +3.7) | (12.25) |
1) Running average based on the daily 20:00 UTC observed solar flux value at
2800 MHz.
2A) Current impact on the monthly sunspot number based on the Boulder
(NOAA/SWPC) sunspot number (accumulated daily sunspots / month days). The
official SIDC international sunspot number is typically 30-50% lower. 2B) Month
average to date.
3) Running average based on the preliminary daily SWPC ap indices.
Values in red are based on the official NGDC
ap indices.
This report has been prepared by Jan Alvestad. It is based on analysis of data from whatever sources are available at the time the report is prepared. All time references are to the UTC day. Comments and suggestions are always welcome.
SDO images are courtesy of NASA/SDO and the AIA, EVE, and HMI science teams.