
Last major update issued on February 14, 2011 at 05:10 UTC.
[Solar and geomagnetic data - last month (updated daily)]
[Solar wind and electron fluence charts (updated daily)
[Solar cycles 21-24 (last update February 1, 2011)]
[Solar cycles 1-20]
[Graphical comparison of cycles 21, 22, 23 and 24 (last update
February 1, 2011)]
[Graphical comparison of cycles 10, 12, 13, 14, 16 and 24 (last update
February 1, 2011)]
[Historical solar and geomagnetic data charts 1954-2006 (last update April 5, 2007)]
[Archived reports since January 2003 (last update February
1, 2011)]
[POES auroral activity level
charts since October 2009]
Annotated geomagnetic activity charts - Carrington rotation 2104
[Nov-Dec.2010]- 2105
[Dec-Jan.2011] NEW
The geomagnetic field was very quiet on February 13. Solar wind speed ranged between 286 and 360 km/s.
Solar flux measured at 20h UTC on 2.8 GHz was 106.8 (increasing 25.0 over the last solar rotation - and a new high for cycle 24). The planetary A index was 2 (STAR Ap - based on the mean of three hour interval ap indices: 1.9). Three hour interval K indices: 12211101 (planetary), 11212110 (Boulder).
The background x-ray flux is at the class B5 level.
At midnight UTC the visible solar disk had 8 spotted regions.
Region 11156 decayed and could become spotless today.
Region 11157 decayed in the southern part and added a few new spots in
the north.
Region 11158 developed very quickly into the largest and most complex
region observed during cycle 24. There are 3 large penumbrae containing many
spots. The central penumbra is complex with an unusually strong magnetic delta
configuration and a long neutral line. Even the trailing penumbra has a weak
magnetic delta structure near its northern edge. There's currently a high
likelihood of further major flares, the region has X class flare potential.
Flares: C1.1 at 12:36, C4.7 at 13:56 and
M6.6/1N at 17:38 UTC. The major flare was accompanied by a weak type II and a
moderate type IV radio sweep. A small CME was observed.
Region 11159 didn't change signif and was quiet.
Region 11160 rotated fully into view and has only a few small spots. Two
opposite polarity spots are poorly separated and there's a chance of C flares. Flare:
C1.4 at 07:29 UTC.
Spotted regions not numbered by NOAA/SWPC:
[S875] This region in the northeast quadrant reemerged with a few
tiny spots. Location at midnight: N21E14
[S876] This region emerged in the southeast quadrant on February 11, was
spotless the next day and reemerged with a few tiny spots on February 13.
Location at midnight: S17E44
[S878] A new region emerged in the northeast quadrant on February 13. Location at midnight:
N15E46
February 11-12: No obviously Earth directed CMEs were observed in LASCO or STEREO
images.
February 13: A small CME was observed after the M6 flare in region 11158.
It is likely to be Earth directed and could reach Earth on February 15 or 16.
Coronal hole history (since late October 2002)
Compare today's report to the situation one solar rotation ago:
28 days ago
27 days ago
26 days ago
No significant coronal holes are currently in or near Earth facing positions.

The darkest areas on the solar disk are likely coronal holes.
Long distance low and medium frequency (below 2 MHz) propagation along paths north of due west over high and upper middle latitudes is fair. Propagation on long distance northeast-southwest paths is poor.
The geomagnetic field is expected to be quiet on February 14. On February 15 and 16 there's a chance of CME effects with unsettled to minor storm conditions possible.
| Coronal holes (1) | Coronal mass ejections (2) | M and X class flares (3) |
1) Effects from a coronal hole could reach Earth
within the next 5 days. When the high speed stream has arrived the
color changes to green.
2) Effects from a CME are likely to be observed at Earth within 96 hours.
3) There is a possibility of either M or X class flares within the next 48 hours.
Green: 0-20% probability, Yellow: 20-60% probability, Red: 60-100% probability.
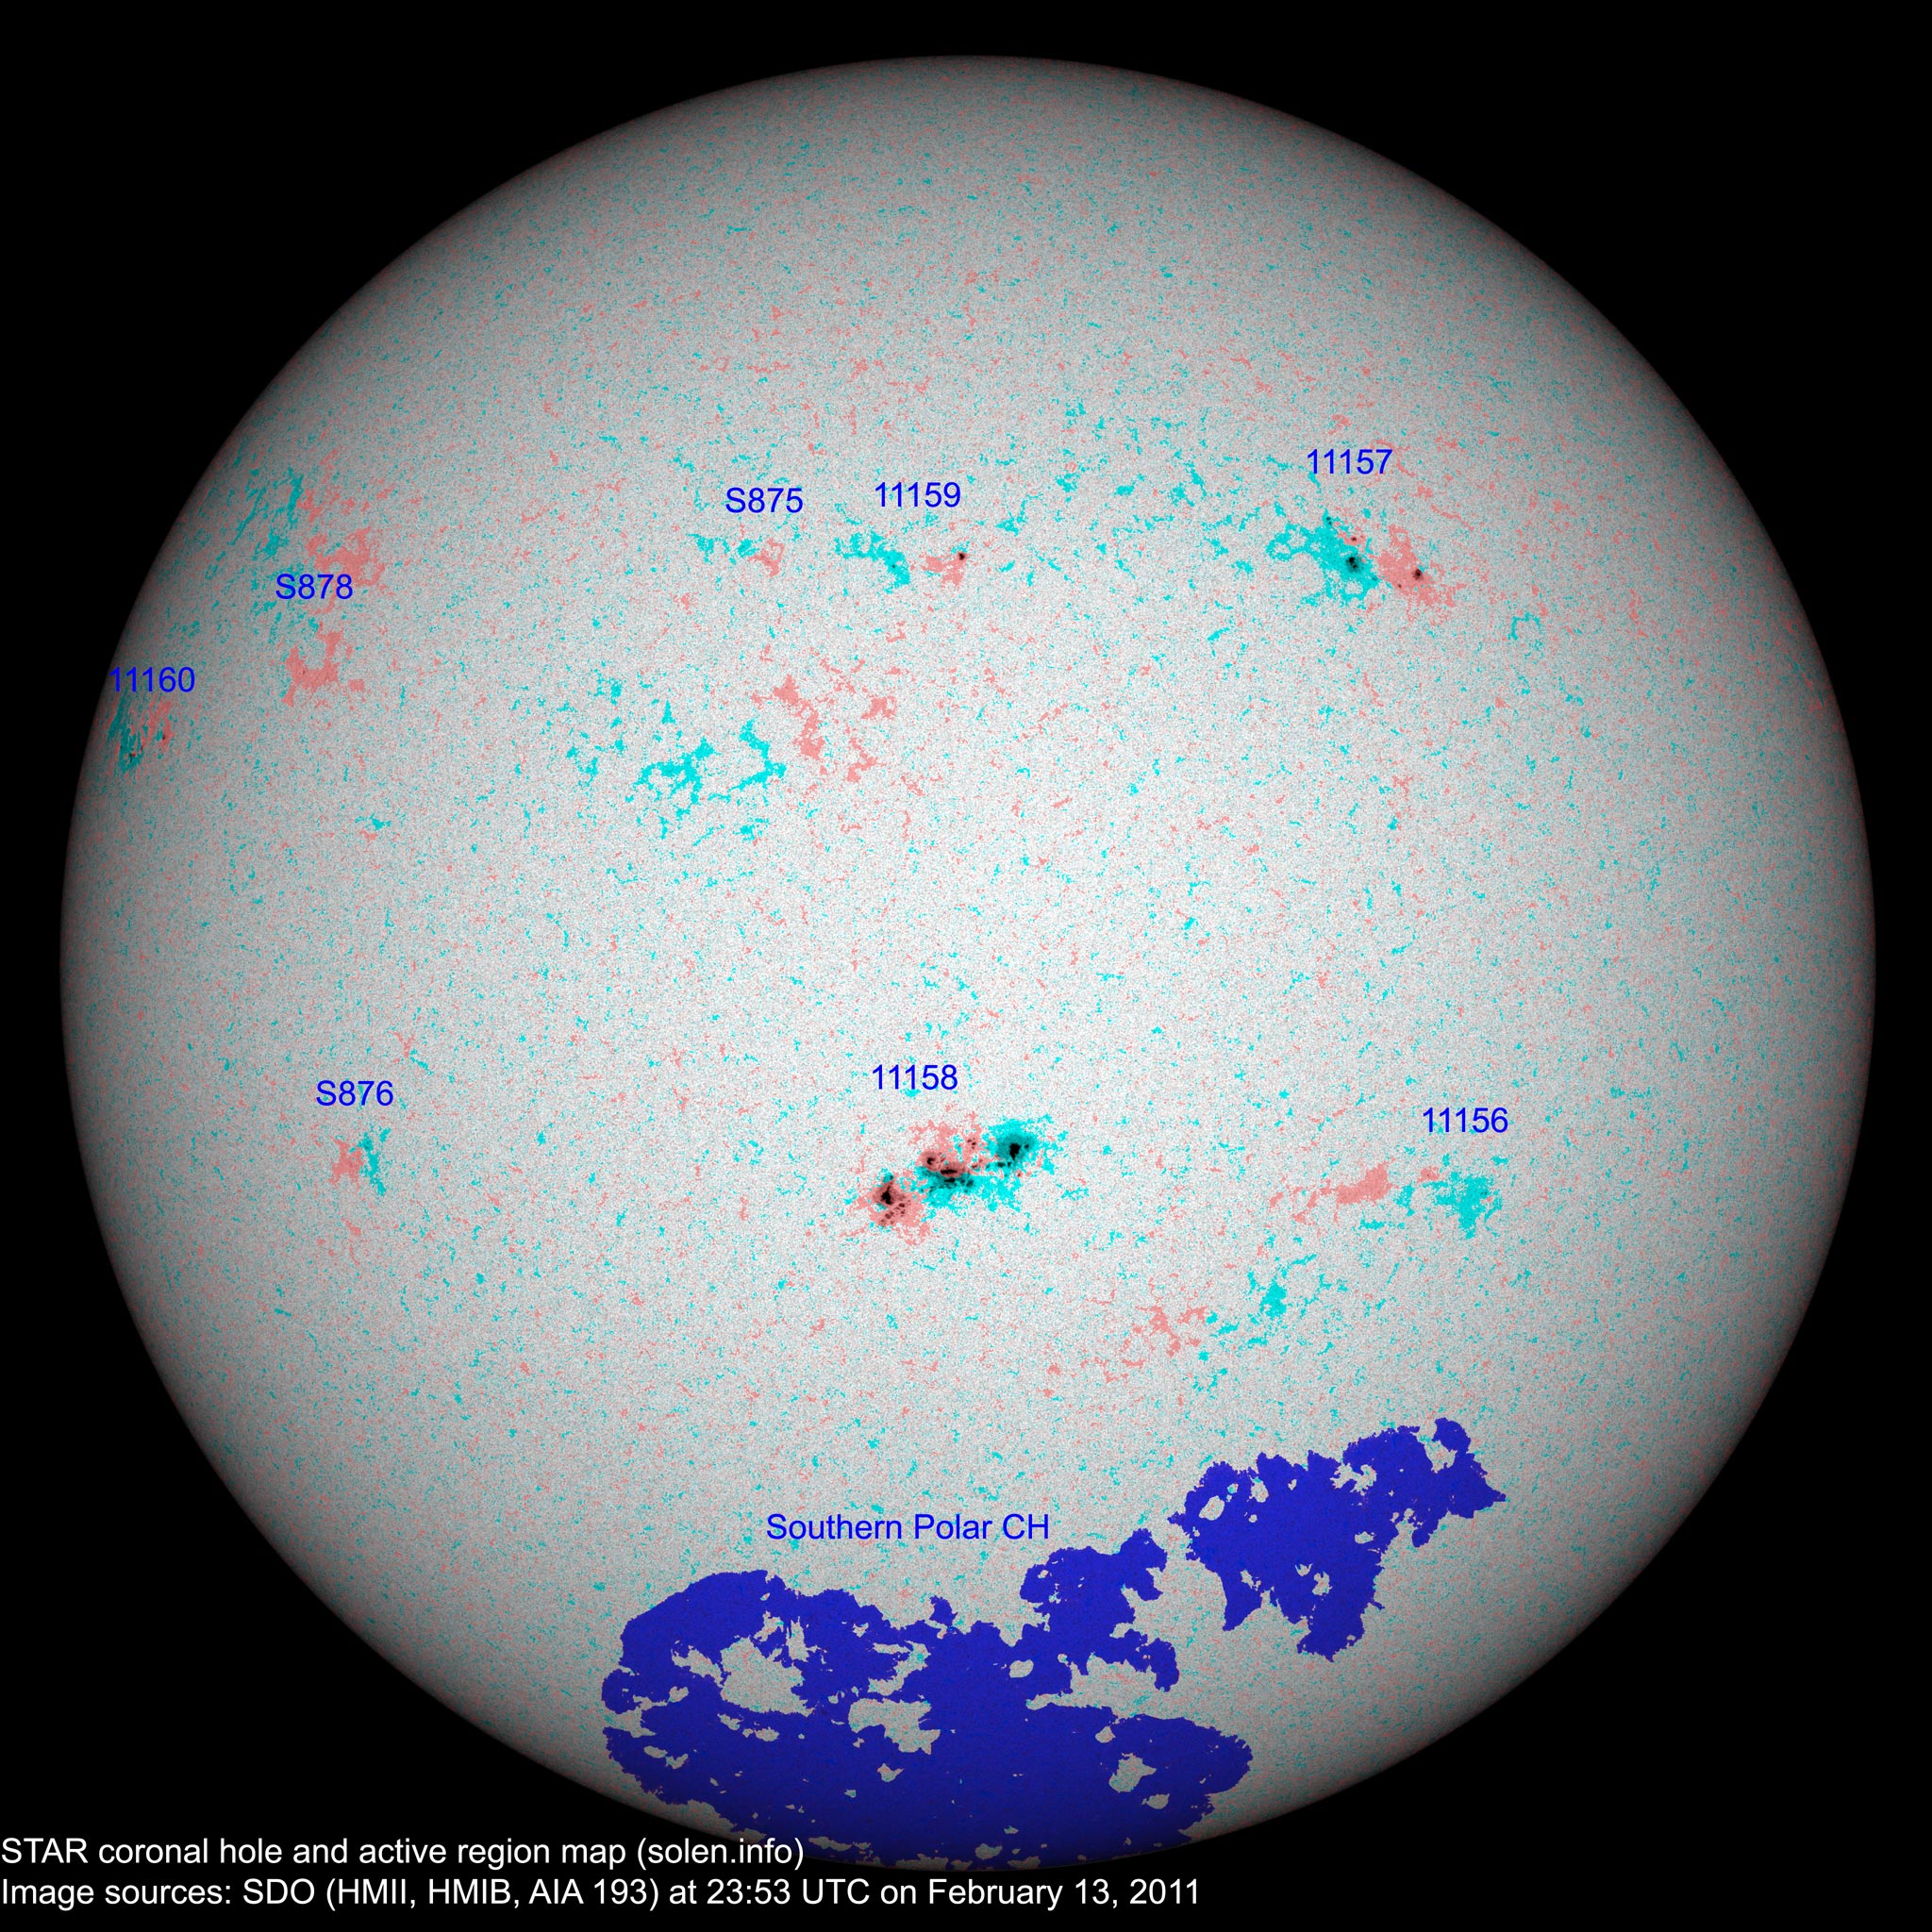
(Click on image for higher resolution image) Compare to the previous day's image
When available the active region map has a coronal hole polarity overlay where red (pink) is negative and blue (blue-green) is positive.
Data for all numbered solar regions according to the Solar Region Summary provided by NOAA/SWPC. Comments are my own, as is the STAR spot count (spots observed at or inside a few hours before midnight) and data for regions not numbered by SWPC or where SWPC has observed no spots. SWPC active region numbers in the table below and in the active region map above are the historic SWPC/USAF numbers.
| Active region | Date numbered detected |
Spot count | Location at midnight | Area | Classification | SDO / HMI 4K continuum image with polarity overlay |
Comment | |||
|---|---|---|---|---|---|---|---|---|---|---|
| SWPC | STAR | SWPC | STAR | Current | Previous | |||||
| 11155 | 2011.02.08 2011.02.07 |
N17W39 | plage | |||||||
| 11156 | 2011.02.08 | 3 | 3 | S21W35 | 0000 | BXO | BXO |
 |
 |
|
| 11157 | 2011.02.08 | 7 | 10 | N18W30 | 0040 | DSO | DSO |
 |
 |
area: 0070 |
| 11158 | 2011.02.11 2011.02.10 |
31 | 55 | S20W03 | 0120 | EAC | EKC |
 |

|
area: 0800 beta-gamma-delta |
| 11159 | 2011.02.11 2011.02.10 |
3 | 4 | N19W01 | 0020 | CSO | CRO |
 |
 |
|
| S875 | 2011.02.10 | 3 | N21E14 | 0000 | BXO |
 |
||||
| S876 | 2011.02.11 | 2 | S17E44 | 0000 | AXX |
 |
||||
| 11160 | 2011.02.12 | 6 | N16E74 | 0020 | BXO |
 |
 |
|||
| S877 | 2011.02.12 | N15W74 |
 |
plage | ||||||
| S878 | 2011.02.13 | 2 | N15E46 | 0000 | AXX |
 |
||||
| Total spot count: | 44 | 85 | ||||||||
| Sunspot number: | 84 | 165 | ||||||||
| Month | Average measured solar flux | International sunspot number (SIDC) | Smoothed sunspot number | Average ap (3) |
|---|---|---|---|---|
| 2008.07 | 65.7 (SF minimum) | 0.5 | 2.8 (-0.4) | |
| 2008.12 | 69.2 | 0.8 | 1.7 (-) sunspot minimum |
3.25 |
| 2009.11 | 73.6 | 4.1 | 7.6 (+0.5) | 2.45 / 2.63 |
| 2009.12 | 76.7 | 10.8 | 8.3 (+0.7) | 1.41 / 1.92 |
| 2010.01 | 81.1 | 13.2 | 9.3 (+1.0) | 2.93 / 3.07 |
| 2010.02 | 84.7 | 18.8 | 10.6 (+1.3) | 4.15 / 4.61 |
| 2010.03 | 83.4 | 15.4 | 12.3 (+1.7) | 4.58 / 4.65 |
| 2010.04 | 75.9 | 8.0 | 14.0 (+1.7) | 10.22 / 10.24 |
| 2010.05 | 73.8 | 8.7 | 15.5 (+1.5) | 9.18 / 8.15 |
| 2010.06 | 72.5 | 13.6 | 16.4 (+0.9) | 8.17 / 6.85 |
| 2010.07 | 79.8 | 16.1 | 16.8 (+0.4) | 6.31 / 5.15 |
| 2010.08 | 79.2 | 19.6 | (17.1 predicted, +0.3) | 8.49 / 7.77 |
| 2010.09 | 81.1 | 25.2 | (17.7 predicted, +0.6) | 5.33 / 5.45 |
| 2010.10 | 81.6 | 23.5 | (19.0 predicted, +1.3) | 6.07 / 6.27 |
| 2010.11 | 82.5 | 21.6 | (20.7 predicted, +1.7) | 4.80 / 5.50 |
| 2010.12 | 84.2 | 14.5 | (22.2 predicted, +1.5) | 3.41 / 4.35 |
| 2011.01 | 83.6 | 19.1 | (23.8 predicted, +1.6) | 4.32 |
| 2011.02 | 86.8 (1) | 20.7 (2A) / 44.6 (2B) | (25.5 predicted, +1.7) | (6.29) |
1) Running average based on the
daily 20:00 UTC observed solar flux
value at 2800 MHz.
2A) Current impact on the monthly sunspot number based on the Boulder (NOAA/SWPC) sunspot number
(accumulated daily sunspots / month days). The official SIDC international sunspot number is typically
30-50% lower. 2B) Month average to date.
3) Running average based on the preliminary
daily SWPC ap indices. Values in red are based on
the
official NGDC ap indices.
This report has been prepared by Jan Alvestad. It is based on analysis of data from whatever sources are available at the time the report is prepared. All time references are to the UTC day. Comments and suggestions are always welcome.
SDO images are courtesy of NASA/SDO and the AIA, EVE, and HMI science teams.
