
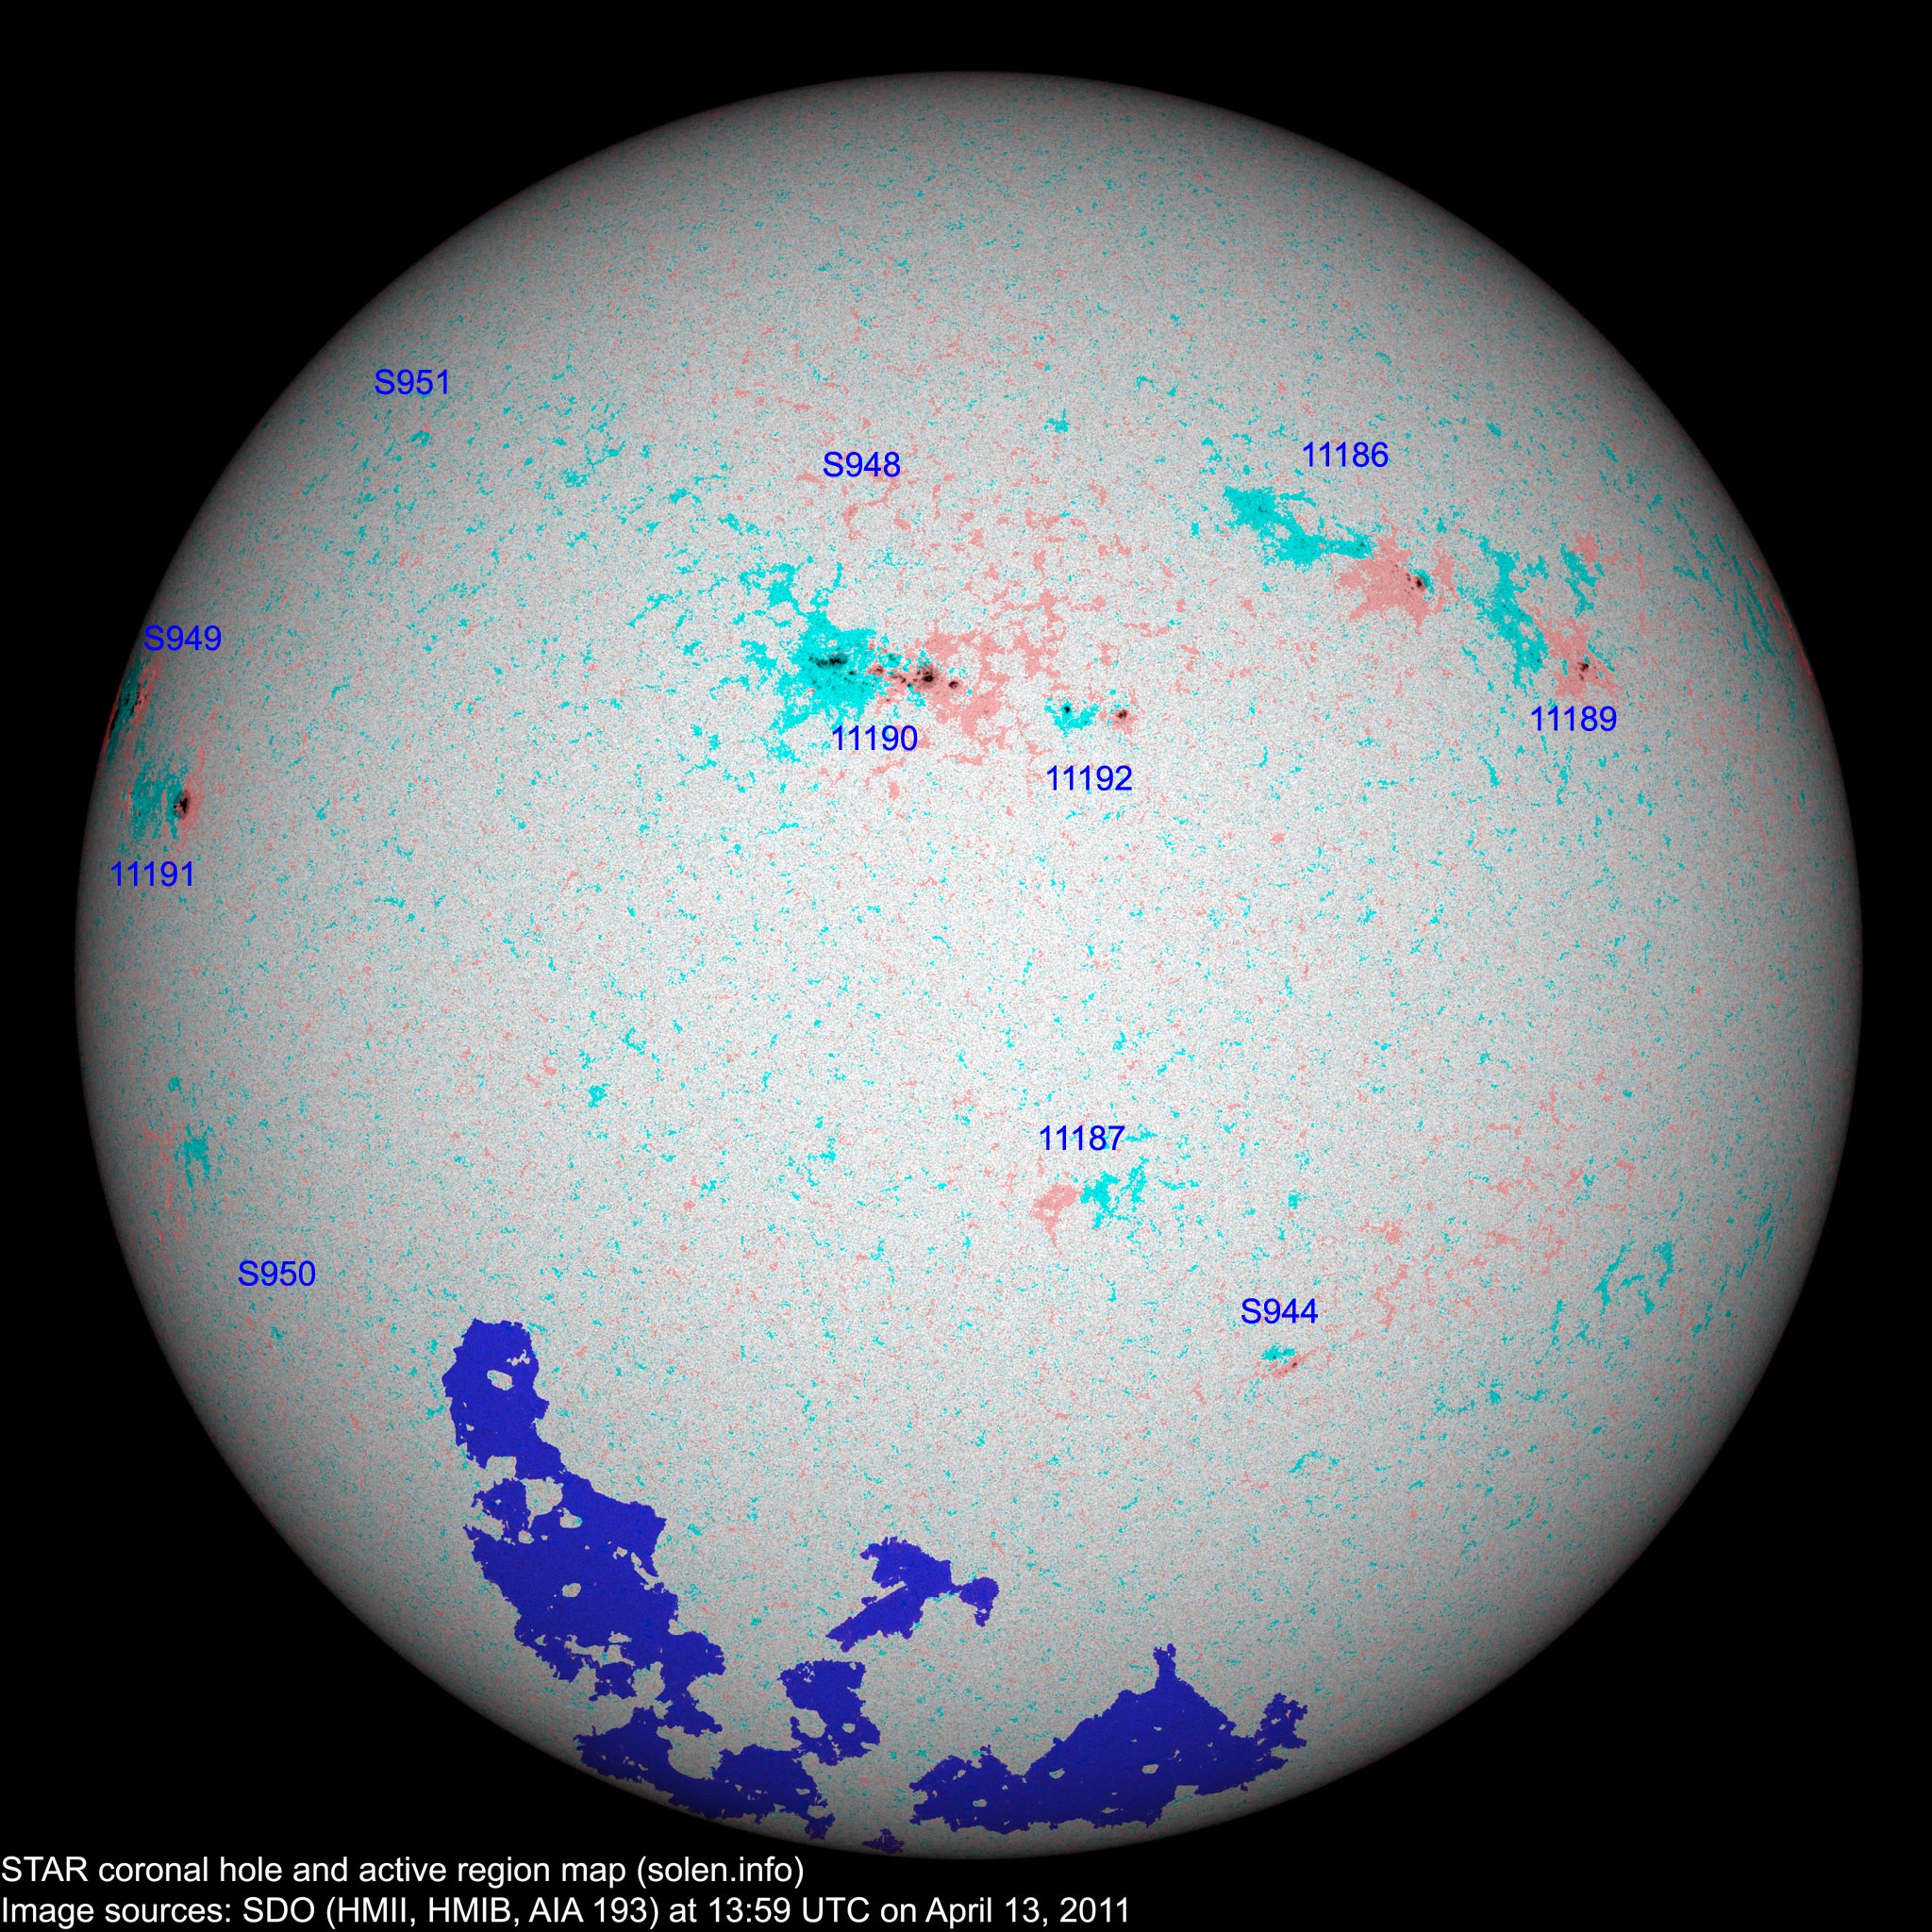
Last major update issued on April 13, 2011 at 04:55 UTC. Minor update posted at 15:00 UTC.
[Solar and geomagnetic data - last month (updated
daily)]
[Solar wind and electron fluence charts (updated
daily)
[Solar cycles 21-24 (last update April 1, 2011)]
[Solar cycles 1-20]
[Graphical comparison of cycles 21, 22, 23 and 24 (last
update April 1, 2011)]
[Graphical comparison of cycles 10, 12, 13, 14, 16 and
24 (last update April 1, 2011)]
[Historical solar and geomagnetic data charts 1954-2006
(last update April 5, 2007)]
[Archived reports since January 2003 (last update April
1, 2011)]
[POES auroral activity level charts since October
2009 - updated April 7, 2011]
Annotated geomagnetic activity charts - Carrington rotation
2106 [Jan.-Feb.2011]
- 2107 [Feb.-March
2011]
The geomagnetic field was quiet to minor storm on April 12. Solar wind speed ranged between 437 and 652 km/s under the influence of a high speed stream originating from an extension of the southern polar coronal hole.
Solar flux estimated at 20h UTC on 2.8 GHz was 110.3 (increasing 16.5 over the last solar rotation). The planetary A index was 23 (STAR Ap - based on the mean of three hour interval ap indices: 23.3). Three hour interval K indices: 22545423 (planetary), 22444412 (Boulder).
The background x-ray flux is at the class B4 level.
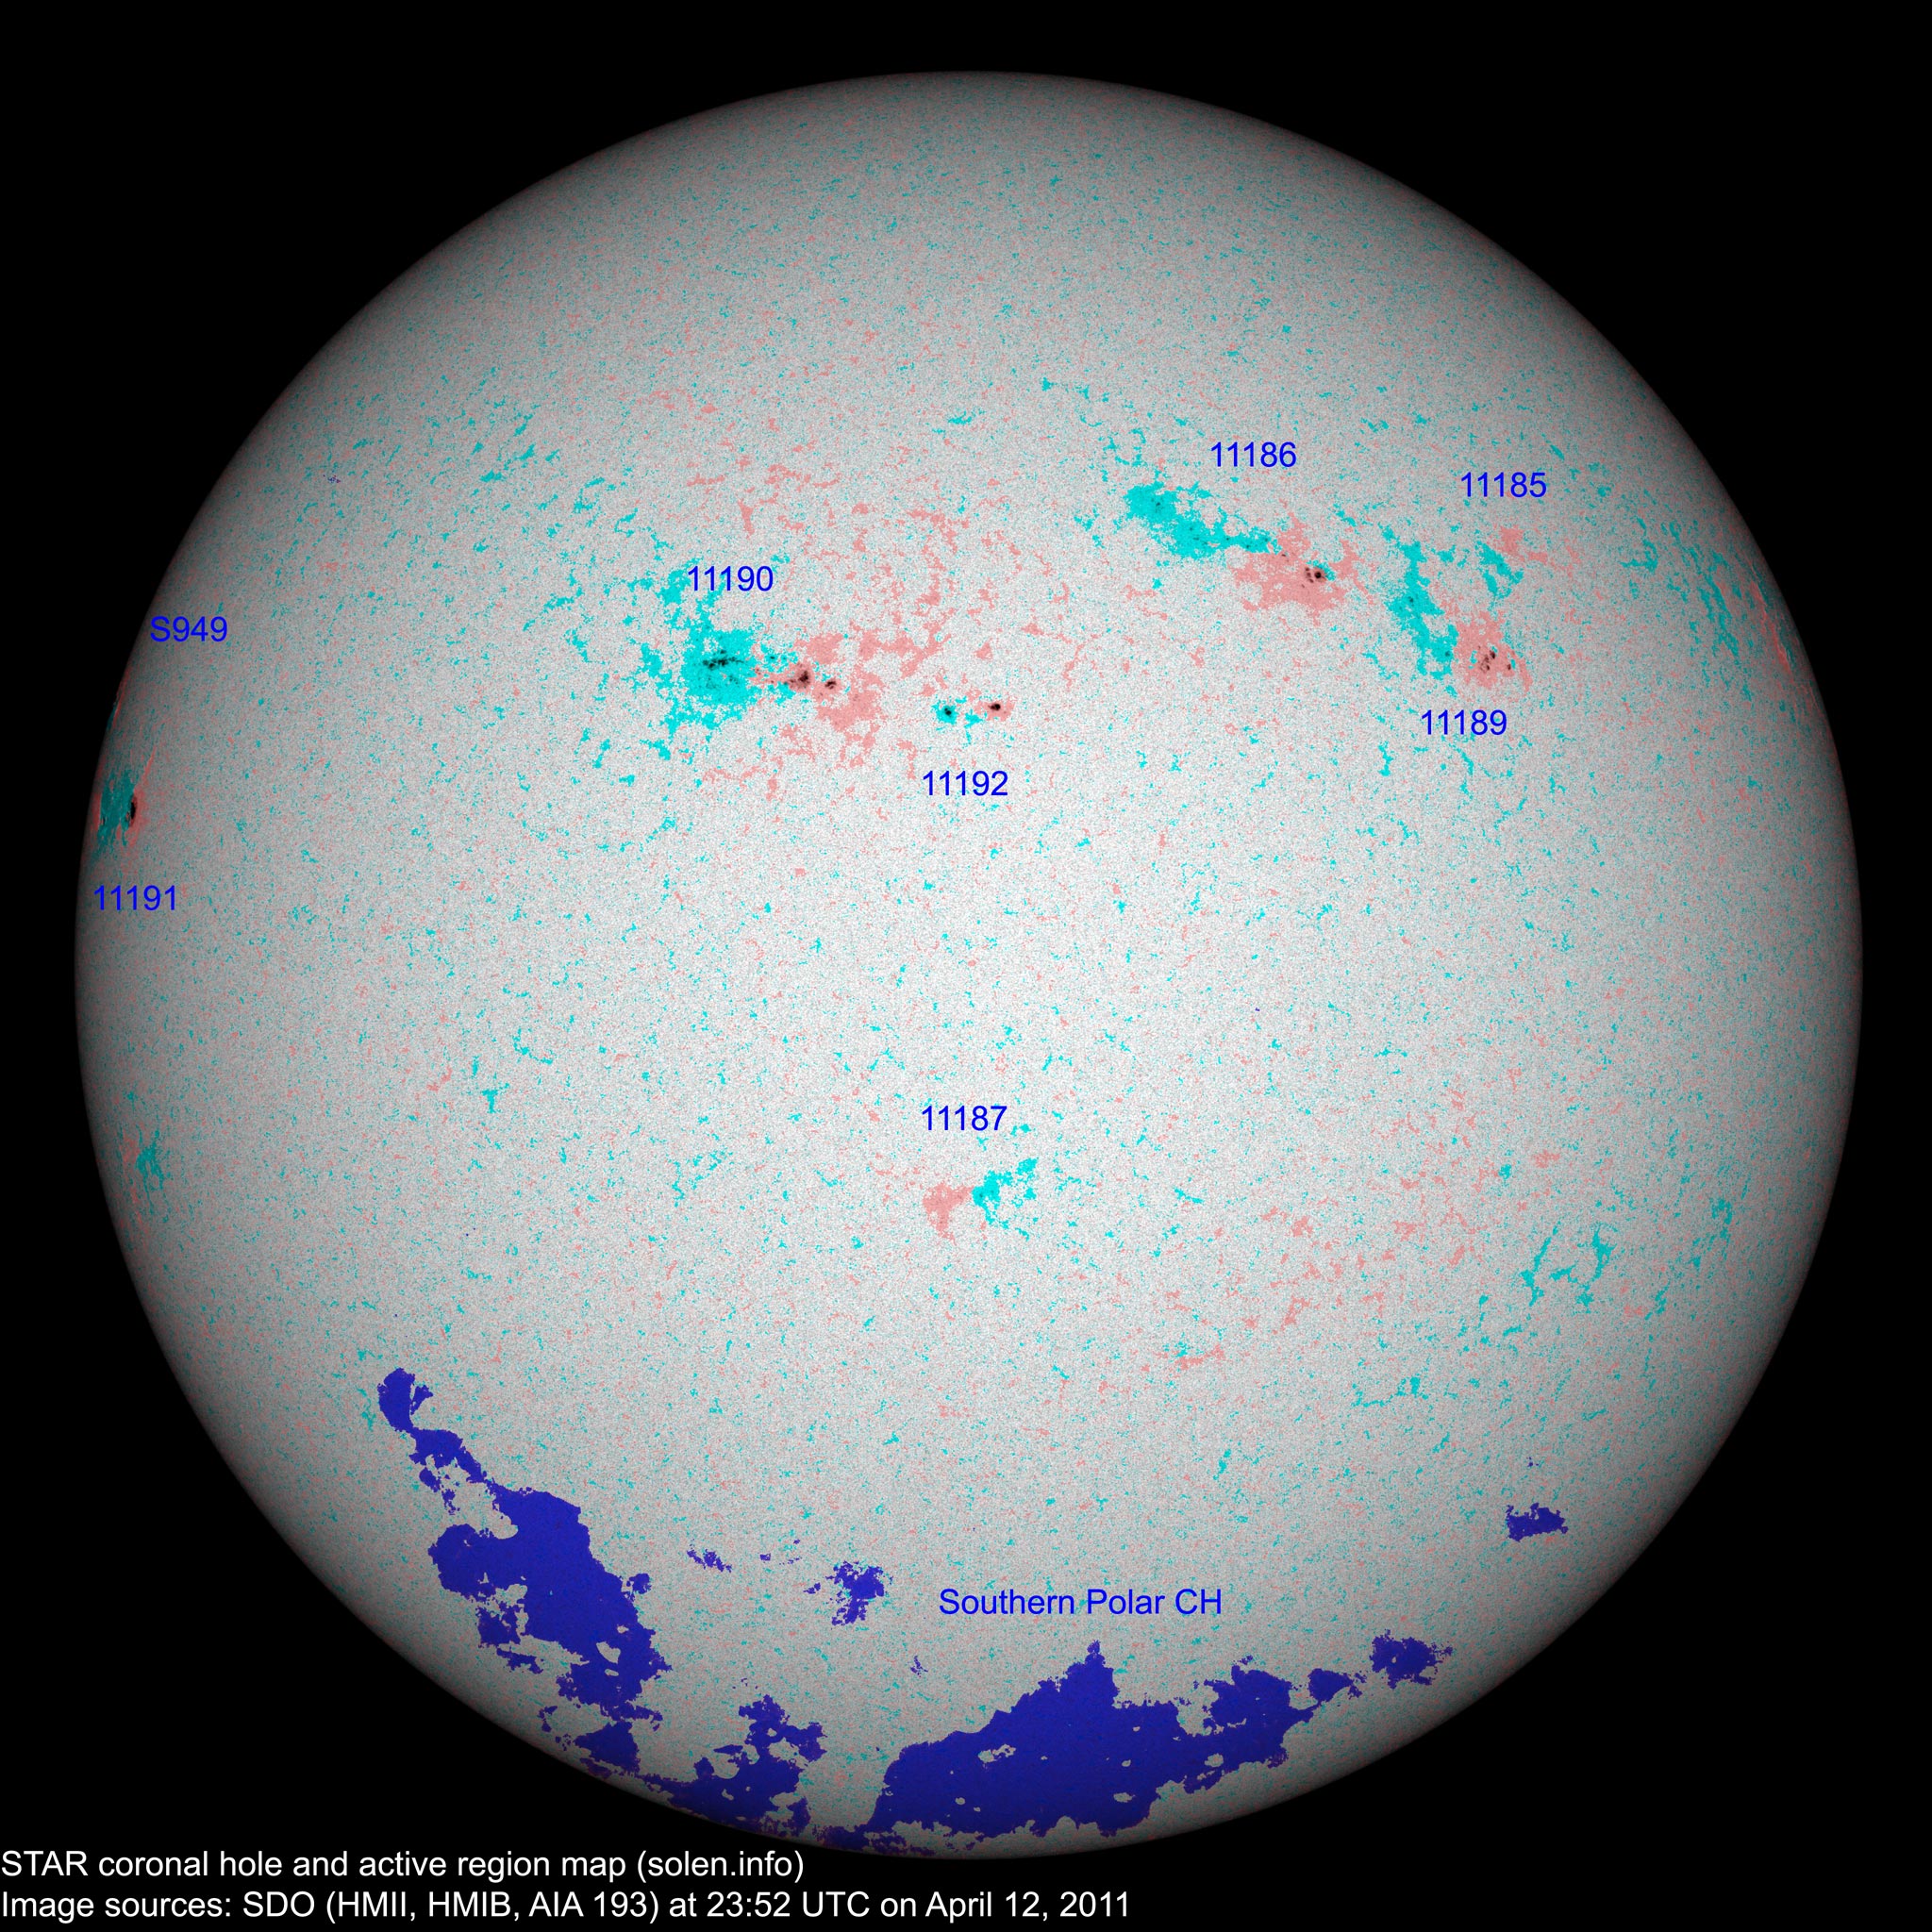
At midnight UTC the visible solar disk had 8 spotted regions.
Region 11185 was quiet and stable.
Region 11186 decayed slowly and quietly.
Region 11187 was quiet and still has a few tiny spots.
Region 11189 was quiet and stable. [Note that SWPC currently has this region as 11185 with
the real region 11185 having been renumbered 11189]
Region 11190 developed further on April 12 and is likely to produce
occasional C flares. Some minor polarity intermixing is still present.
Flares: C1.7/1F at 03:46 and C3.1 at 06:07 UTC.
New region 11191 rotated partly into view at the northeast limb on April
11 and was numbered the next day by NOAA/SWPC. No significant changes were
observed on April 12.
New region 11192 emerged quickly early in the day to the west of region
11190. Development slowed significantly as the opposite polarity fields drifted
apart.
Spotted regions not numbered by NOAA/SWPC:
[S949] rotated partly into view at the northeast limb on April 12. Location at midnight:
N15E86. This region could have an interesting magnetic layout based on the
activity displayed at the limb.
Comment added at 15:00 UTC on April 13: The background xray flux has increased today with region S949 rotating into view. The region at 14 UTC had 15 spots, mixed polarites and a DAC classification. An M class flare is possible. Region S944 has reemerged and was located at S32W24 at 14h UTC with 6 spots and a BXO classification. Two new regions have emerged, S950 at S28E61 with 2 spots (BXO) and S951 at N32E47 with a single spot (AXX). Additionally S948 again has a spot, which means that the total number of spotted regions was 11 at the time of this high resolution STAR CHARMAP.
April 10-12: No obviously Earth directed CMEs were observed in LASCO and STEREO imagery.
Coronal hole history (since late October
2002)
Compare today's report to the situation one solar rotation ago:
28 days ago
27 days
ago 26
days ago
No obvious coronal holes are currently in or near Earth facing positions. An extension (CH444) of the southern polar coronal hole was Earth facing on April 7-8.

The darkest areas on the solar disk are likely coronal holes.
Long distance low and medium frequency (below 2 MHz) propagation along paths north of due west over high and upper middle latitudes is poor. Propagation on long distance northeast-southwest paths is fair.
The geomagnetic field is expected to be quiet to active on April 13 and quiet on April 14-15.
| Coronal holes (1) | Coronal mass ejections (2) | M and X class flares (3) |
1) Effects from a coronal hole could reach Earth within the
next 5 days. When the high speed stream has arrived the color changes to
green.
2) Effects from a CME are likely to be observed at Earth within 96 hours.
3) There is a possibility of either M or X class flares within the next 48
hours.
Green: 0-20% probability, Yellow: 20-60% probability, Red: 60-100% probability.
(Click on image for higher resolution image) Compare to the previous day's image
When available the active region map has a coronal hole polarity overlay where red (pink) is negative and blue (blue-green) is positive.
Data for all numbered solar regions according to the Solar Region Summary provided by NOAA/SWPC. Comments are my own, as is the STAR spot count (spots observed at or inside a few hours before midnight) and data for regions not numbered by SWPC or where SWPC has observed no spots. SWPC active region numbers in the table below and in the active region map above are the historic SWPC/USAF numbers.
| Active region | Date numbered detected |
Spot count | Location at midnight | Area | Classification | SDO / HMI 4K continuum image with polarity overlay |
Comment | |||
|---|---|---|---|---|---|---|---|---|---|---|
| SWPC | STAR SDO | SWPC | STAR | Current | Previous | |||||
| 11185 | 2011.04.03 2011.04.04 |
10 | 1 | 0040 | CSO |
 |
 |
SWPC data is for region 11189 area: 0000 |
||
| S932 | 2011.04.04 | N13W42 | plage | |||||||
| S933 | 2011.04.04 | N26W58 |
 |
plage | ||||||
| 11186 | 2011.04.05 2011.04.06 |
16 | 16 | N22W20 | 0090 | CSI | CSO |
 |
 |
|
| 11188 | 2011.04.05 2011.04.08 |
S24W62 | location: S26W56 | |||||||
| S937 | 2011.04.05 | S18W61 | plage | |||||||
| 11189 | 2011.04.06 2011.04.08 |
14 | 0030 | CRO |
 |
 |
location: N16W35 |
|||
| 11187 | 2011.04.06 2011.04.07 |
5 | 5 | S20W01 | 0020 | BXO | BXO |
 |
 |
area: 0000 |
| S940 | 2011.04.06 | S22W49 | plage | |||||||
| S942 | 2011.04.07 | N07W54 | plage | |||||||
| 11190 | 2011.04.08 2011.04.11 |
20 | 25 | N15E12 | 0110 | DAI | DAI |
 |
 |
beta-gamma location: N13E14 |
| S944 | 2011.04.09 | S32W18 | plage | |||||||
| S945 | 2011.04.09 | N08W33 | plage | |||||||
| 11191 | 2011.04.11 2011.04.12 |
1 | 4 | N09E71 | 0060 | HSX | CSO |
 |
 |
formerly region S946 location: N08E74 |
| 11192 | 2011.04.12 | 2 | 4 | N11W01 | 0020 | BXO | CRO |
 |
location: N10W00 | |
| S949 | 2011.04.12 | 1 | N15E86 | 0050 | HSX |
 |
||||
| Total spot count: | 54 | 70 | ||||||||
| Sunspot number: | 114 | 150 | ||||||||
| Month | Average measured solar flux | International sunspot number (SIDC) | Smoothed sunspot number | Average ap (3) |
|---|---|---|---|---|
| 2008.07 | 65.7 (SF minimum) | 0.5 | 2.8 (-0.4) | |
| 2008.12 | 69.2 | 0.8 | 1.7 (-) sunspot minimum |
3.25 |
| 2010.02 | 84.7 | 18.8 | 10.6 (+1.3) | 4.15 / 4.61 |
| 2010.03 | 83.4 | 15.4 | 12.3 (+1.7) | 4.58 / 4.65 |
| 2010.04 | 75.9 | 8.0 | 14.0 (+1.7) | 10.22 / 10.24 |
| 2010.05 | 73.8 | 8.7 | 15.5 (+1.5) | 9.18 / 8.15 |
| 2010.06 | 72.5 | 13.6 | 16.4 (+0.9) | 8.17 / 6.85 |
| 2010.07 | 79.8 | 16.1 | 16.7 (+0.3) | 6.31 / 5.15 |
| 2010.08 | 79.2 | 19.6 | 17.4 (+0.7) | 8.49 / 7.77 |
| 2010.09 | 81.1 | 25.2 | 19.6 (+2.2) | 5.33 / 5.45 |
| 2010.10 | 81.6 | 23.5 | (22.6 predicted, +3.0) | 6.07 / 6.27 |
| 2010.11 | 82.5 | 21.5 | (25.7 predicted, +3.1) | 4.80 / 5.50 |
| 2010.12 | 84.2 | 14.4 | (28.9 predicted, +3.2) | 3.41 / 4.35 |
| 2011.01 | 83.6 | 19.1 | (31.9 predicted, +3.0) | 4.32 / 5.51 |
| 2011.02 | 94.6 | 29.4 | (34.4 predicted, +2.5) | 5.41 / 6.44 |
| 2011.03 | 115.0 | 56.2 | (36.7 predicted, +2.3) | 7.79 |
| 2011.04 | 109.7 (1) | 30.0 (2A) / 75.1 (2B) | (39.6 predicted, +2.9) | (12.57) |
1) Running average based on the daily 20:00 UTC observed solar flux value at
2800 MHz.
2A) Current impact on the monthly sunspot number based on the Boulder
(NOAA/SWPC) sunspot number (accumulated daily sunspots / month days). The
official SIDC international sunspot number is typically 30-50% lower. 2B) Month
average to date.
3) Running average based on the preliminary daily SWPC ap indices.
Values in red are based on the official NGDC
ap indices.
This report has been prepared by Jan Alvestad. It is based on analysis of data from whatever sources are available at the time the report is prepared. All time references are to the UTC day. Comments and suggestions are always welcome.
SDO images are courtesy of NASA/SDO and the AIA, EVE, and HMI science teams.