
Last major update issued on April 2, 2011 at 05:55 UTC.
[Solar and geomagnetic data - last month (updated
daily)]
[Solar wind and electron fluence charts (updated
daily)
[Solar cycles 21-24 (last update April 1, 2011)]
[Solar cycles 1-20]
[Graphical comparison of cycles 21, 22, 23 and 24 (last
update April 1, 2011)]
[Graphical comparison of cycles 10, 12, 13, 14, 16 and
24 (last update April 1, 2011)]
[Historical solar and geomagnetic data charts 1954-2006
(last update April 5, 2007)]
[Archived reports since January 2003 (last update April
1, 2011)]
[POES auroral activity level charts since October
2009 - updated April 1, 2011]
Annotated geomagnetic activity charts - Carrington rotation
2106 [Jan.-Feb.2011]
- 2107 [Feb.-March
2011]
The geomagnetic field was quiet to active on April 1. Solar wind speed ranged between 290 and 494 km/s. A geomagnetic disturbance has been in progress since 9h UTC. The source of the disturbance is uncertain. While a coronal hole is a possibility, solar wind density has been high since the onset of the disturbance. SOHO/MTOF recorded a quick increase in solar wind speed, density and thermal velocity near 16h UTC.
Solar flux estimated at 20h UTC on 2.8 GHz was 108.9 (decreasing 25.7 over the last solar rotation). The planetary A index was 13 (STAR Ap - based on the mean of three hour interval ap indices: 13.1). Three hour interval K indices: 11123443 (planetary), 11123443 (Boulder).
The background x-ray flux is at the class B2 level.
At midnight UTC the visible solar disk had 11 spotted regions.
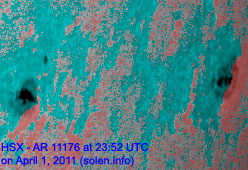
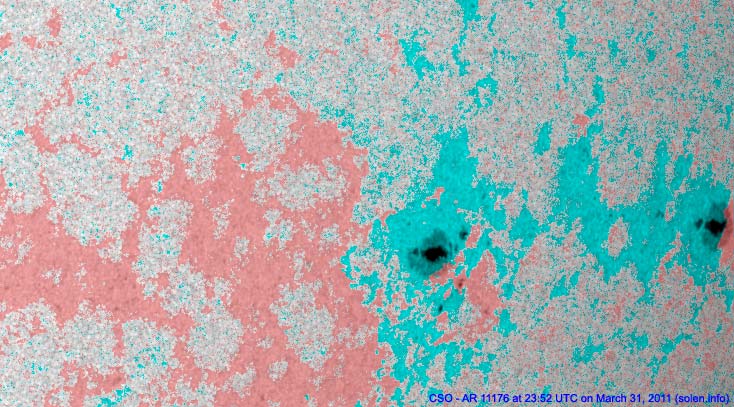
Region 11176 decayed further losing all trailing polarity spots.
Flare: C3.1 at 03:54 UTC.
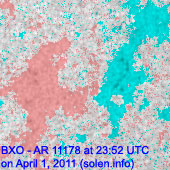
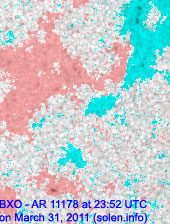
Region 11178 decayed and could become spotless today.
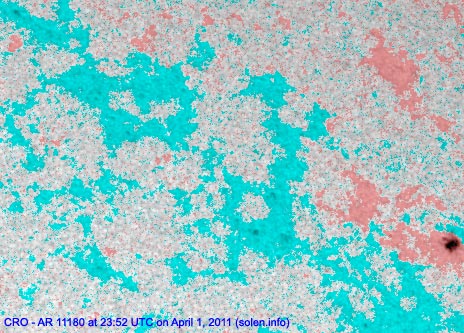
Region 11180 was quiet and stable.
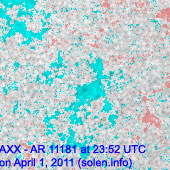
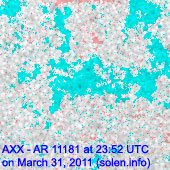
Region 11181 has only a single tiny spot and could become spotless today.
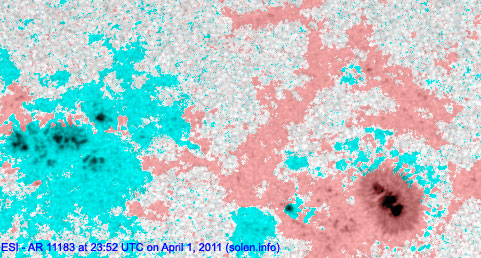
Region 11183 developed slowly with polarity intermixing increasing both
in the leading and trailing spot sections.
Flare: C3.4 at 01:56 (incorrectly attributed
to 11176 by NOAA/SWPC) UTC.
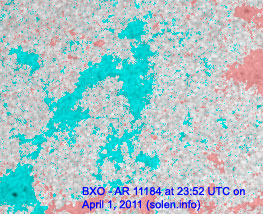
New region 11184 emerged in the northeast quadrant on March 30 and was
noticed by NOAA/SWPC two days later. The region decayed slowly on April 1.
Spotted regions not numbered by NOAA/SWPC:
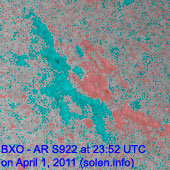
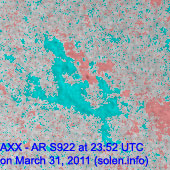
[S922] reemerged on March 30 with a single tiny spot and added
another spot on April 1. Location at midnight: N24W53
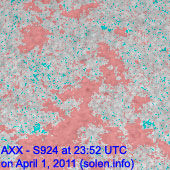
[S924] reemerged on April 1 with a tiny spot. Location at midnight:
N37E04
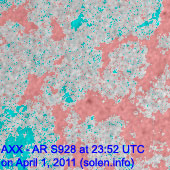
[S928] emerged with spots in an old plage field in the northeast quadrant on
April 1. Location at midnight: N12E38
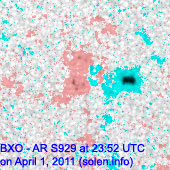
[S929] emerged in the southern hemisphere near the central meridian on
April 1. Location at midnight: S25W04
[S930] emerged in the southwest quadrant on April 1. Location at midnight:
S07W22
March 30 - April 1: No obviously Earth directed CMEs were observed in LASCO and STEREO imagery.
Coronal hole history (since late October
2002)
Compare today's report to the situation one solar rotation ago:
28 days ago
27 days
ago 26
days ago
No obvious coronal holes are currently in or near Earth facing positions.
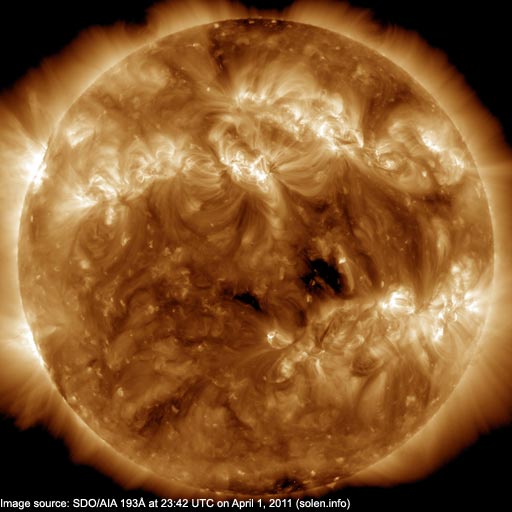
The darkest areas on the solar disk are likely coronal holes.
Long distance low and medium frequency (below 2 MHz) propagation along paths north of due west over high and upper middle latitudes is poor. Propagation on long distance northeast-southwest paths is fair.
The geomagnetic field is expected to be quiet to active on April 2 and quiet on April 3-4.
| Coronal holes (1) | Coronal mass ejections (2) | M and X class flares (3) |
1) Effects from a coronal hole could reach Earth within the
next 5 days. When the high speed stream has arrived the color changes to
green.
2) Effects from a CME are likely to be observed at Earth within 96 hours.
3) There is a possibility of either M or X class flares within the next 48
hours.
Green: 0-20% probability, Yellow: 20-60% probability, Red: 60-100% probability.
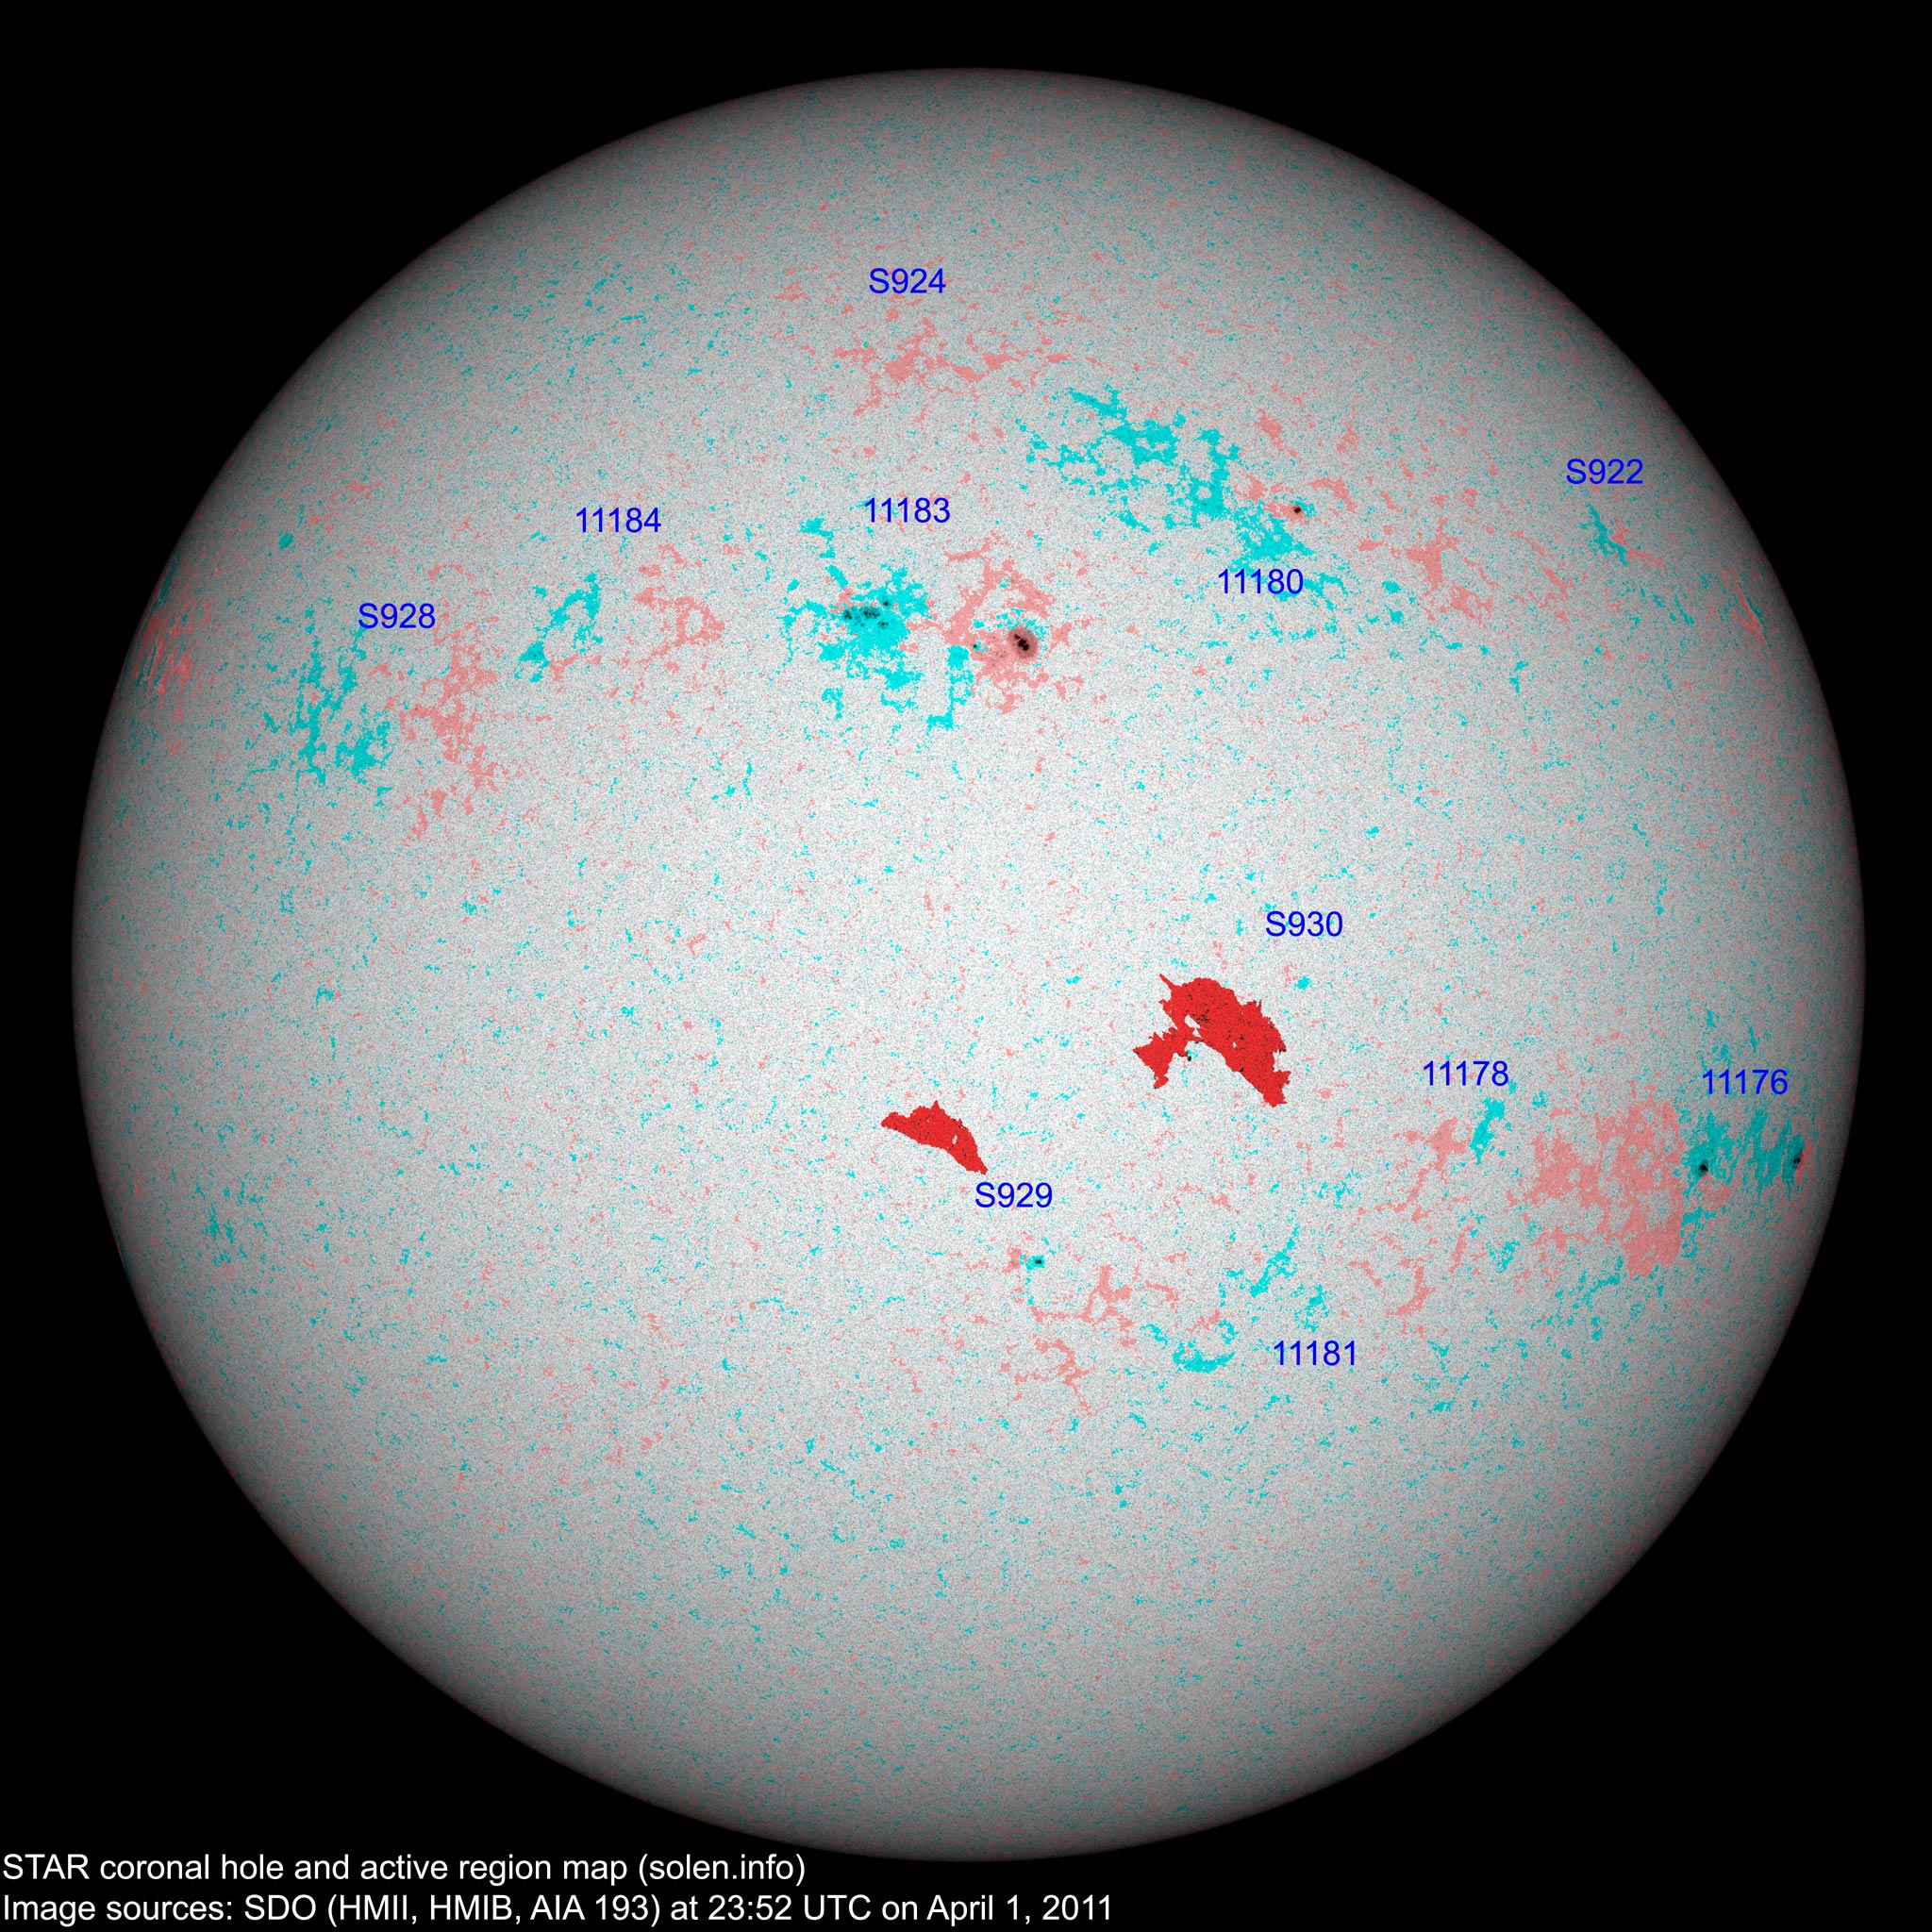
(Click on image for higher resolution image) Compare to the previous day's image
When available the active region map has a coronal hole polarity overlay where red (pink) is negative and blue (blue-green) is positive.
Data for all numbered solar regions according to the Solar Region Summary provided by NOAA/SWPC. Comments are my own, as is the STAR spot count (spots observed at or inside a few hours before midnight) and data for regions not numbered by SWPC or where SWPC has observed no spots. SWPC active region numbers in the table below and in the active region map above are the historic SWPC/USAF numbers.
| Active region | Date numbered detected |
Spot count | Location at midnight | Area | Classification | SDO / HMI 4K continuum image with polarity overlay |
Comment | |||
|---|---|---|---|---|---|---|---|---|---|---|
| SWPC | STAR SDO | SWPC | STAR | Current | Previous | |||||
| 11176 | 2011.03.21 | 4 | 5 | S15W65 | 0100 | FSO | HSX |
 |
 |
|
| 11178 | 2011.03.24 | 5 | S17W36 | 0000 | BXO |
 |
 |
|
||
| 11181 | 2011.03.24 2011.03.25 |
1 | S27W22 | 0000 | AXX |
 |
 |
location: S28W25 | ||
| 11180 | 2011.03.24 2011.03.25 |
1 | 6 | N25W25 | 0010 | HRX | CRO |
 |
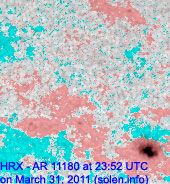 |
location: N27W16 |
| S920 | 2011.03.25 | S25W38 | plage | |||||||
| 11183 | 2011.03.26 2011.03.27 |
16 | 31 | N17E01 | 0220 | ESI | ESI |
 |
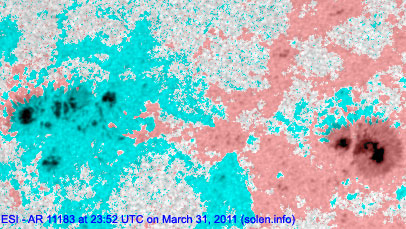 |
beta-gamma location: N15E01 |
| S922 | 2011.03.26 | 2 | N24W53 | 0000 | BXO |
 |
 |
|||
| S923 | 2011.03.27 | S26W27 | plage | |||||||
| S924 | 2011.03.29 | 1 | N37E04 | 0000 | AXX |
 |
||||
| 11184 | 2011.03.30 2011.04.01 |
1 | 3 | N15E29 | 0000 | AXX | BXO |
 |
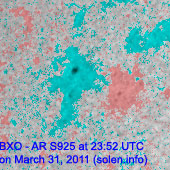 |
formerly region S925 location: N17E25 |
| S926 | 2011.03.30 | N21W33 | plage | |||||||
| S927 | 2011.03.31 | N25E52 |
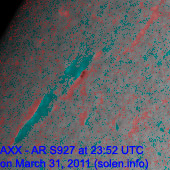 |
plage | ||||||
| S928 | 2011.04.01 | 2 | N12E38 | 0000 | AXX |
 |
||||
| S929 | 2011.04.01 | 4 | S25W04 | 0020 | BXO |
 |
||||
| S930 | 2011.04.01 | 1 | S07W22 | 0000 | AXX |
 |
||||
| Total spot count: | 22 | 61 | ||||||||
| Sunspot number: | 62 | 171 | ||||||||
| Month | Average measured solar flux | International sunspot number (SIDC) | Smoothed sunspot number | Average ap (3) |
|---|---|---|---|---|
| 2008.07 | 65.7 (SF minimum) | 0.5 | 2.8 (-0.4) | |
| 2008.12 | 69.2 | 0.8 | 1.7 (-) sunspot minimum |
3.25 |
| 2010.02 | 84.7 | 18.8 | 10.6 (+1.3) | 4.15 / 4.61 |
| 2010.03 | 83.4 | 15.4 | 12.3 (+1.7) | 4.58 / 4.65 |
| 2010.04 | 75.9 | 8.0 | 14.0 (+1.7) | 10.22 / 10.24 |
| 2010.05 | 73.8 | 8.7 | 15.5 (+1.5) | 9.18 / 8.15 |
| 2010.06 | 72.5 | 13.6 | 16.4 (+0.9) | 8.17 / 6.85 |
| 2010.07 | 79.8 | 16.1 | 16.8 (+0.4) | 6.31 / 5.15 |
| 2010.08 | 79.2 | 19.6 | 17.4 (+0.6) | 8.49 / 7.77 |
| 2010.09 | 81.1 | 25.2 | 19.6 (+2.2) | 5.33 / 5.45 |
| 2010.10 | 81.6 | 23.5 | (22.6 predicted, +3.0) | 6.07 / 6.27 |
| 2010.11 | 82.5 | 21.6 | (25.8 predicted, +3.2) | 4.80 / 5.50 |
| 2010.12 | 84.2 | 14.5 | (28.9 predicted, +3.1) | 3.41 / 4.35 |
| 2011.01 | 83.6 | 19.1 | (31.9 predicted, +3.0) | 4.32 |
| 2011.02 | 94.6 | 29.4 | (34.4 predicted, +2.5) | 5.41 |
| 2011.03 | 115.0 | 56.2 | (36.7 predicted, +2.3) | 7.79 |
| 2011.04 | 108.9 (1) | 2.1 (2A) / 62.0 (2B) | (39.2 predicted, +2.5) | (13.1) |
1) Running average based on the daily 20:00 UTC observed solar flux value at
2800 MHz.
2A) Current impact on the monthly sunspot number based on the Boulder
(NOAA/SWPC) sunspot number (accumulated daily sunspots / month days). The
official SIDC international sunspot number is typically 30-50% lower. 2B) Month
average to date.
3) Running average based on the preliminary daily SWPC ap indices.
Values in red are based on the official NGDC
ap indices.
This report has been prepared by Jan Alvestad. It is based on analysis of data from whatever sources are available at the time the report is prepared. All time references are to the UTC day. Comments and suggestions are always welcome.
SDO images are courtesy of NASA/SDO and the AIA, EVE, and HMI science teams.