
Last major update issued on June 24, 2010 at 03:40 UTC.
[Solar and geomagnetic data - last month (updated daily)]
[Solar wind and electron fluence charts (updated daily)
[Solar cycles 21-24 (last update May 26, 2010)]
[Solar cycles 1-20]
[Graphical comparison of cycles 21, 22 and 23 (last update October 4, 2007)]
[Graphical comparison of cycles 2, 10, 13, 17, 20 and 23 (last update October 4, 2007)]
[Historical solar and geomagnetic data charts 1954-2006 (last update April 5, 2007)]
[Archived reports (last update April 2, 2010)]
The geomagnetic field was quiet on June 23. Solar wind speed ranged between 276 and 338 km/s.
Solar flux measured at 20h UTC on 2.8 GHz was 74.0. The planetary A index was 4 (STAR Ap - based on the mean of three hour interval ap indices: 4.5). Three hour interval K indices: 11111121 (planetary), 11111210 (Boulder).
The background x-ray flux is at the class A5 level.
At midnight there was 1 spotted region on the visible solar disk.
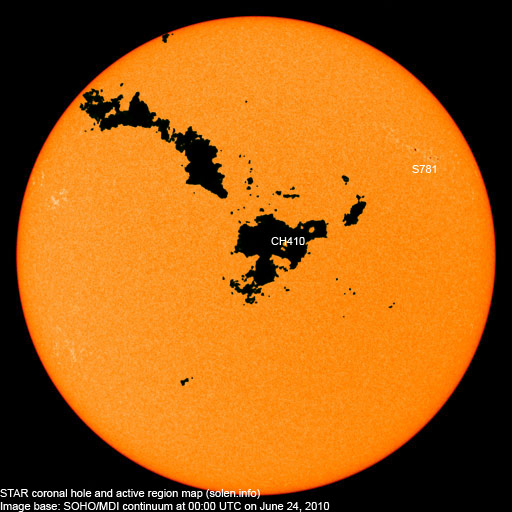
The original region 11082 remained spotless. The region currently assigned that number by NOAA/SWPC emerged as a bipolar region (S781) to the southwest of region 11082 on June 19. The region was mostly unchanged on June 23.
June 21-23: No obviously Earth directed CMEs were seen in LASCO or STEREO images.
Coronal hole history (since late October 2002)
Compare today's report to the situation one solar rotation ago:
28 days ago
27 days ago
26 days ago
A recurrent trans equatorial coronal hole (CH410) was in an Earth facing position on June 22-24.
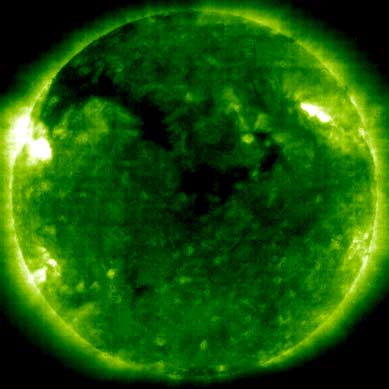
Processed SOHO/EIT 195 image at 00:00 UTC on June 24. The darkest areas on the solar disk are likely coronal holes.
Long distance low and medium frequency (below 2 MHz) propagation along paths north of due west over high and upper middle latitudes is fair. Propagation on long distance northeast-southwest paths is poor.
The geomagnetic field is expected to be quiet on June 24. A high speed stream from CH410 could cause quiet to minor storm conditions on June 25-27.
| Coronal holes (1) | Coronal mass ejections (2) | M and X class flares (3) |
1) Effects from a coronal hole could reach Earth
within the next 5 days. When the high speed stream has arrived the
color changes to green.
2) Effects from a CME are likely to be observed at Earth within 96 hours.
3) There is a possibility of either M or X class flares within the next 48 hours.
Green: 0-20% probability, Yellow: 20-60% probability, Red: 60-100% probability.
Compare to the previous day's image
Data for all numbered solar regions according to the Solar Region Summary provided by NOAA/SWPC. Comments are my own, as is the STAR spot count (spots observed at or inside a few hours before midnight) and data for regions not numbered by SWPC or where SWPC has observed no spots. SWPC active region numbers in the table below and in the active region map above are the historic SWPC/USAF numbers.
| Active region | Date numbered | SWPC spot count |
STAR spot count |
Location at midnight | Area | SWPC Classification |
Comment |
|---|---|---|---|---|---|---|---|
| 11082 | 2010.06.17 | 4 | N26W52 | 0020 | CAO | spotless, SWPC has merged this region with S781 actual location: N29W42 |
|
| 11083 | 2010.06.19 | N19W74 | plage | ||||
| S781 | 2010.06.19 | 4 | N26W52 | 0020 | (CSO) | ||
| Total spot count: | 4 | 4 | |||||
| SSN: | 14 | 14 | |||||
| Month | Average measured solar flux | International sunspot number (SIDC) | Smoothed sunspot number | Average ap (3) |
|---|---|---|---|---|
| 2000.04 | 184.2 | 125.5 | 120.8 cycle 23 sunspot max. |
|
| 2000.07 | 202.3 | 170.1 | 119.8 | |
| 2001.12 | 235.1 | 132.2 | 114.6 (-0.9) | |
| 2008.07 | 65.7 (SF minimum) | 0.5 | 2.8 (-0.4) | |
| 2008.12 | 69.2 | 0.8 | 1.7 (-) sunspot minimum |
3.25 |
| 2009.03 | 69.2 | 0.7 | 2.0 (+0.1) | 4.85 |
| 2009.04 | 69.7 | 0.8 | 2.2 (+0.2) | 4.52 |
| 2009.05 | 70.5 | 2.9 | 2.3 (+0.1) | 4.75 |
| 2009.06 | 68.6 | 2.9 | 2.7 (+0.4) | 5.22 |
| 2009.07 | 68.2 | 3.2 | 3.6 (+0.9) | 5.49 / 4.55 |
| 2009.08 | 67.3 | 0.0 | 4.8 (+1.2) | 5.70 / 4.89 |
| 2009.09 | 70.5 | 4.3 | 6.1 (+1.3) | 3.88 / 3.61 |
| 2009.10 | 72.6 | 4.8 | 7.0 (+0.9) | 3.66 / 3.56 |
| 2009.11 | 73.6 | 4.1 | 7.6 (+0.6) | 2.45 / 2.63 |
| 2009.12 | 76.7 | 10.8 | (8.2 predicted, +0.6) | 1.41 / 1.92 |
| 2010.01 | 81.1 | 13.1 | (9.2 predicted, +1.0) | 2.93 / 3.07 |
| 2010.02 | 84.7 | 18.6 | (10.7 predicted, +1.5) | 4.15 / 4.61 |
| 2010.03 | 83.4 | 15.4 | (12.5 predicted, +1.8) | 4.58 / 4.65 |
| 2010.04 | 75.9 | 7.9 | (14.1 predicted, +1.6) | 10.22 / 10.24 |
| 2010.05 | 73.8 | 8.8 | (15.4 predicted, +1.3) | 9.18 / 8.15 |
| 2010.06 | 72.0 (1) | 15.2 (2) | (16.9 predicted, +1.5) | (7.16) |
1) Running average based on the
daily 20:00 UTC observed solar flux
value at 2800 MHz.
2) Current impact on the monthly sunspot number based on the Boulder (NOAA/SWPC) sunspot number
(accumulated daily sunspots / month days). The official international sunspot number is typically
30-50% lower.
3) Running average based on the
daily SWPC ap indices. Values in red are based on
the
official NGDC ap indices.
This report has been prepared by Jan Alvestad. It is based partly on my own observations and analysis, and partly on data from some of these solar data sources. All time references are to the UTC day. Comments and suggestions are always welcome.