
Last major update issued on September 1, 2010 at 04:25 UTC.
[Solar and geomagnetic data - last month (updated daily)]
[Solar wind and electron fluence charts (updated daily)
[Solar cycles 21-24 (last update August 3, 2010)]
[Solar cycles 1-20]
[Graphical comparison of cycles 21, 22, 23 and 24 (last update
August 3, 2010)]
[Graphical comparison of cycles 10, 12, 13, 14, 16 and 24 (last update
August 3, 2010)]
[Historical solar and geomagnetic data charts 1954-2006 (last update April 5, 2007)]
[Archived reports (last update August 23, 2010)]
The geomagnetic field was very quiet on August 31. Solar wind speed ranged between 303 and 351 km/s.
Solar flux measured at 20h UTC on 2.8 GHz was 74.6 (down 6.2 over the last solar rotation). The planetary A index was 2 (STAR Ap - based on the mean of three hour interval ap indices: 2.5). Three hour interval K indices: 10011011 (planetary), 00001110 (Boulder).
The background x-ray flux is at the class A6 level.
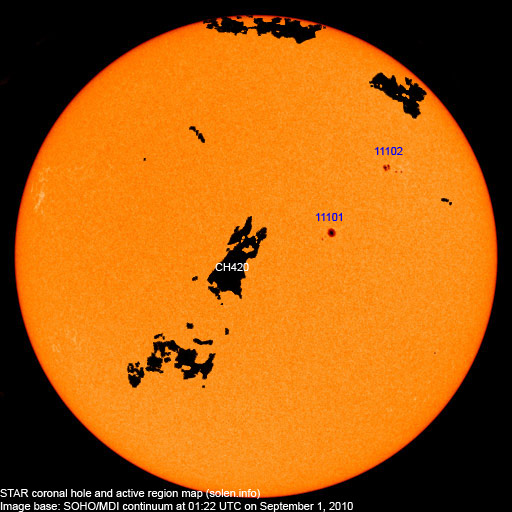
At midnight UTC the visible solar disk had 2 spotted regions.
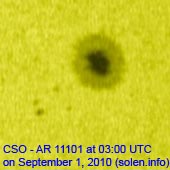
Region 11101 lost the spots which emerged the previous day, however,
new flux emerged to the southeast and several small spots appeared.
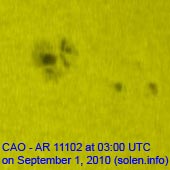
Region 11102 was quiet.
August 29-31: No obviously Earth directed CMEs were seen in LASCO or STEREO images.
Coronal hole history (since late October 2002)
Compare today's report to the situation one solar rotation ago:
28 days ago
27 days ago
26 days ago
A trans equatorial coronal hole (CH419) was Earth facing on August 27-28. A recurrent trans equatorial coronal hole (CH420) will be Earth facing on September 1.
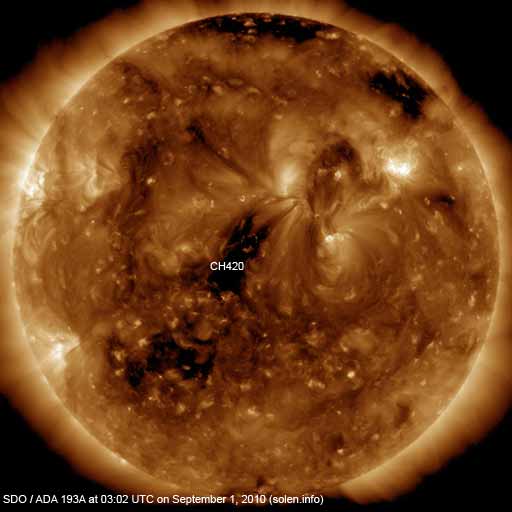
Image courtesy of SDO (NASA) and the AIA consortium. Annotations are my own. The darkest areas on the solar disk are likely coronal holes.
Long distance low and medium frequency (below 2 MHz) propagation along paths north of due west over high and upper middle latitudes is fair to good. Propagation on long distance northeast-southwest paths is poor.
The geomagnetic field is expected to be mostly quiet on September 1-3. On September 1 there's a chance of unsettled intervals if effects from CH419 arrive. Quiet to active conditions are possible on September 4-5 due to effects from CH420.
| Coronal holes (1) | Coronal mass ejections (2) | M and X class flares (3) |
1) Effects from a coronal hole could reach Earth
within the next 5 days. When the high speed stream has arrived the
color changes to green.
2) Effects from a CME are likely to be observed at Earth within 96 hours.
3) There is a possibility of either M or X class flares within the next 48 hours.
Green: 0-20% probability, Yellow: 20-60% probability, Red: 60-100% probability.
Compare to the previous day's image
Data for all numbered solar regions according to the Solar Region Summary provided by NOAA/SWPC. Comments are my own, as is the STAR spot count (spots observed at or inside a few hours before midnight) and data for regions not numbered by SWPC or where SWPC has observed no spots. SWPC active region numbers in the table below and in the active region map above are the historic SWPC/USAF numbers.
| Active region | Date numbered | Spot count | Location at midnight | Area | Classification | SDO (NASA) / AIA 4500 image |
Comment | |||
|---|---|---|---|---|---|---|---|---|---|---|
| SWPC | STAR | SWPC | STAR | Current | Previous | |||||
| 11101 | 2010.08.24 | 1 | 5 | N12W19 | 0140 | HRX | CSO |
 |
 |
|
| S804 | 2010.08.26 | S07W50 | plage | |||||||
| 11102 | 2010.08.29 | 6 | 7 | N28W40 | 0080 | CRO | CAO |
 |
 |
|
| Total spot count: | 7 | 12 | ||||||||
| SSN: | 27 | 32 | ||||||||
| Month | Average measured solar flux | International sunspot number (SIDC) | Smoothed sunspot number | Average ap (3) |
|---|---|---|---|---|
| 2000.04 | 184.2 | 125.5 | 120.8 cycle 23 sunspot max. |
|
| 2000.07 | 202.3 | 170.1 | 119.8 | |
| 2001.12 | 235.1 | 132.2 | 114.6 (-0.9) | |
| 2008.07 | 65.7 (SF minimum) | 0.5 | 2.8 (-0.4) | |
| 2008.12 | 69.2 | 0.8 | 1.7 (-) sunspot minimum |
3.25 |
| 2009.06 | 68.6 | 2.9 | 2.7 (+0.4) | 5.22 |
| 2009.07 | 68.2 | 3.2 | 3.6 (+0.9) | 5.49 / 4.55 |
| 2009.08 | 67.3 | 0.0 | 4.8 (+1.2) | 5.70 / 4.89 |
| 2009.09 | 70.5 | 4.3 | 6.2 (+1.4) | 3.88 / 3.61 |
| 2009.10 | 72.6 | 4.8 | 7.1 (+0.9) | 3.66 / 3.56 |
| 2009.11 | 73.6 | 4.1 | 7.6 (+0.5) | 2.45 / 2.63 |
| 2009.12 | 76.7 | 10.8 | 8.3 (+0.7) | 1.41 / 1.92 |
| 2010.01 | 81.1 | 13.2 | 9.3 (+1.0) | 2.93 / 3.07 |
| 2010.02 | 84.7 | 18.8 | (10.6 predicted, +1.3) | 4.15 / 4.61 |
| 2010.03 | 83.4 | 15.4 | (12.3 predicted, +1.7) | 4.58 / 4.65 |
| 2010.04 | 75.9 | 7.9 | (13.9 predicted, +1.6) | 10.22 / 10.24 |
| 2010.05 | 73.8 | 8.8 | (15.3 predicted, +1.4) | 9.18 / 8.15 |
| 2010.06 | 72.5 | 13.5 | (16.7 predicted, +1.4) | 8.17 / 6.85 |
| 2010.07 | 79.8 | 16.1 | (18.3 predicted, +1.6) | 6.31 / 5.15 |
| 2010.08 | 79.2 (1) | 28.2 (2A) / 28.2 (2B) | (19.5 predicted, +1.2) | (8.49) |
1) Running average based on the
daily 20:00 UTC observed solar flux
value at 2800 MHz.
2A) Current impact on the monthly sunspot number based on the Boulder (NOAA/SWPC) sunspot number
(accumulated daily sunspots / month days). The official international sunspot number is typically
30-50% lower. 2B) Month average to date.
3) Running average based on the
daily SWPC ap indices. Values in red are based on
the
official NGDC ap indices.
This report has been prepared by Jan Alvestad. It is based on analysis of data from whatever sources are available at the time the report is prepared. All time references are to the UTC day. Comments and suggestions are always welcome.