
Last major update issued on September 19, 2006 at 02:40 UTC.
[Solar and
geomagnetic data - last month (updated daily)]
[Solar wind and
electron fluence charts (updated daily)]
[Solar cycles 21-23
(last update September 3, 2006)]
[Solar cycles 1-20]
[Graphical comparison
of cycles 21, 22 and 23 (last update September 3, 2006)]
[Graphical
comparison of cycles 2, 10, 13, 17, 20 and 23 (last update September 3, 2006)]
[Historical solar and
geomagnetic data charts 1954-2005 (last update March 3, 2006)]
[Archived reports (last update
September 8, 2006)]
The geomagnetic field was quiet to minor storm on September 18. Solar wind speed ranged between 466 and 632 km/s (all day average 551 km/s - increasing 163 km/s over the previous day) under the influence of a high speed stream from CH239.
Solar flux measured at 20h UTC on 2.8 GHz was 74.2. The planetary A index was 24 (STAR Ap - based on the mean of three hour interval ap indices: 24.4). Three hour interval K indices: 55333253 (planetary), 54442243 (Boulder).
The background x-ray flux is at the class A3 level.
At midnight there was 1 spotted region on the visible solar disk. The solar flare activity level was low. A single C class event was recorded during the day.
New region 10910 rotated into view at the southeast limb on September 16 and was noticed by NOAA/SEC two days later. The region was generally unchanged and is magnetically somewhat more complex than expected from the single, small spot. Flare: C1.0 at 19:45 UTC.
September 16-18: No obvious partly or fully Earth directed CMEs were detected in LASCO imagery.
Coronal hole history (since late October 2002)
Compare today's report to the situation one solar rotation ago:
28 days ago
27 days ago
26 days ago
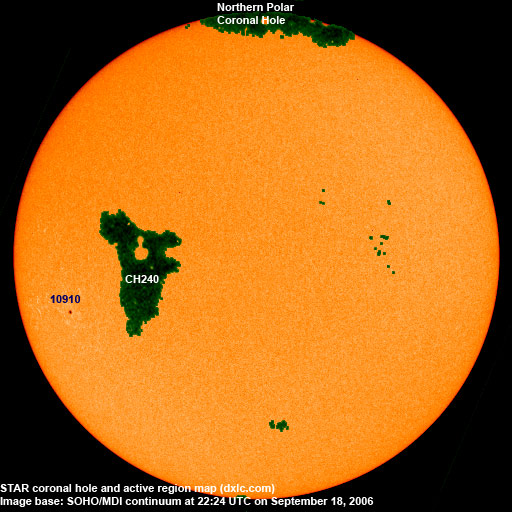
A recurrent trans equatorial coronal hole (CH239) was in an Earth facing position on September 13-14. A recurrent trans equatorial coronal hole (CH240) will rotate into an Earth facing position on September 20-22.
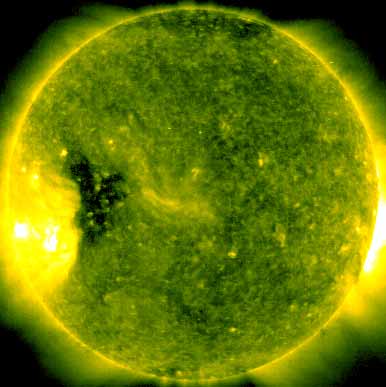
Processed SOHO/EIT 284 image at 19:06 UTC on September 18. The darkest areas on the solar disk are likely coronal holes.
The geomagnetic field is expected to be quiet to active on September 19 under the influence of a high speed stream from CH239. Quiet to unsettled conditions are likely on September 20-22 becoming unsettled to minor storm on September 23-24 due to a high speed stream from CH240.
| Coronal holes (1) | Coronal mass ejections (2) | M and X class flares (3) |
1) Effects from a coronal hole could reach Earth
within the next 5 days. When the high speed stream has arrived the color changes to green.
2) Effects from a CME are likely to be observed at Earth within 96 hours.
3) There is a possibility of either M or X class flares within the next 48 hours.
Green: 0-20% probability, Yellow: 20-60% probability, Red: 60-100% probability.
Long distance low and medium frequency (below 2 MHz) propagation along east-west paths over high and upper middle latitudes is very poor. Weak signals were heard from 930 CJYQ, 1030 WBZ and 1510 WWZN. Propagation on long distance northeast-southwest paths is good. Some stations from Argentina and Uruguay had strong to very strong signals (notably 930 Montecarlo, 1030 del Plata, 1050 SODRE, 1070 El Mundo, 1130 Nacional, 1190 América and 1470 Cristal del Uruguay).
Compare to the previous day's image.
Data for all numbered solar regions according to the Solar Region Summary provided by NOAA/SEC. Comments are my own, as is the STAR spot count (spots observed at or inside a few hours before midnight) and data for regions not numbered by SEC or where SEC has observed no spots. SEC active region numbers in the table below and in the active region map above are the historic SEC/USAF numbers.
| Active region | Date numbered | SEC spot count |
STAR spot count |
Location at midnight | Area | Classification | Comment |
|---|---|---|---|---|---|---|---|
| 10910 | 2006.09.18 | 1 | 1 | S08E49 | 0030 | HSX | formerly region S675 |
| Total spot count: | 1 | 1 | |||||
| SSN: | 11 | 11 | |||||
| Month | Average solar flux at Earth |
International sunspot number | Smoothed sunspot number |
|---|---|---|---|
| 2000.04 | 184.2 | 125.5 | 120.8 cycle 23 sunspot max. |
| 2000.07 | 202.3 | 170.1 | 119.8 |
| 2001.12 | 235.1 | 132.2 | 114.6 (-0.9) |
| 2005.07 | 96.4 | 40.1 | 29.1 (+0.3) |
| 2005.08 | 90.5 | 36.4 | 27.4 (-1.7) |
| 2005.09 | 91.1 | 21.9 | 25.8 (-1.6) |
| 2005.10 | 77.0 | 8.5 | 25.5 (-0.3) |
| 2005.11 | 86.3 | 18.0 | 24.9 (-0.6) |
| 2005.12 | 90.7 | 41.2 | 23.0 (-1.9) |
| 2006.01 | 83.4 | 15.4 | 20.8 (-2.2) |
| 2006.02 | 76.5 | 4.7 | 18.6 (-2.2) |
| 2006.03 | 75.4 | 10.8 | (17.1 predicted, -1.5) |
| 2006.04 | 89.0 | 30.2 | (16.4 predicted, -0.7) |
| 2006.05 | 80.9 | 22.2 | (15.9 predicted, -0.5) |
| 2006.06 | 76.5 | 13.9 | (14.1 predicted, -1.8) |
| 2006.07 | 75.7 | 12.2 | (12.4 predicted, -1.7) |
| 2006.08 | 79.0 | 12.9 | (11.9 predicted, -0.5) |
| 2006.09 | 81.4 (1) | 17.0 (2) | (11.9 predicted, -0.0) |
1) Running average based on the
daily 20:00 UTC observed solar flux
value at 2800 MHz.
2) Unofficial, accumulated value based on the Boulder (NOAA/SEC)
sunspot number. The official international sunspot number is typically
30-50% lower.
This report has been prepared by Jan Alvestad. It is based partly on my own observations and analysis, and partly on data from some of these solar data sources. All time references are to the UTC day. Comments and suggestions are always welcome.
| [DX-Listeners' Club] |