
Last major update issued on November 15, 2006 at 04:10 UTC.
[Solar and
geomagnetic data - last month (updated daily)]
[Solar wind and
electron fluence charts (updated daily)]
[Solar cycles 21-23
(last update November 12, 2006)]
[Solar cycles 1-20]
[Graphical comparison
of cycles 21, 22 and 23 (last update November 12, 2006)]
[Graphical
comparison of cycles 2, 10, 13, 17, 20 and 23 (last update November 12, 2006)]
[Historical solar and
geomagnetic data charts 1954-2005 (last update March 3, 2006)]
[Archived reports (last update
November 12, 2006)]
The geomagnetic field was quiet on November 14. Solar wind speed ranged between 319 and 393 km/s (all day average 359 km/s - decreasing 49 km/s from the previous day).
Solar flux measured at 20h UTC on 2.8 GHz was 94.5. The planetary A index was 4 (STAR Ap - based on the mean of three hour interval ap indices: 3.5). Three hour interval K indices: 01111112 (planetary), 01111112 (Boulder).
The background x-ray flux is at the class A5 level.
At midnight there were 3 spotted regions on the visible solar disk. The solar flare activity level was very low. No C class events were recorded during the day.
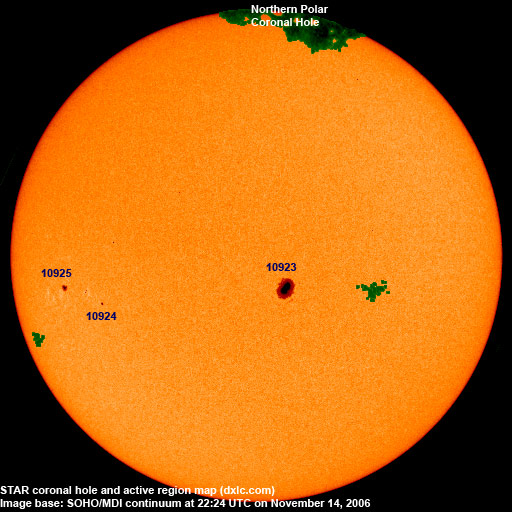
Region 10923 was mostly unchanged and quiet.
Region 10924 was quiet and stable.
New region 10925 was assigned to the spot which had first become visible
at the east limb and which should have been region 10924 if the standard
numbering scheme had been followed. What is now region 10924 are the spots which
emerged to the west of that spot one day after it rotated into view.
November 12-14: No obvious partly or fully Earth directed CMEs were detected in LASCO imagery.
Coronal hole history (since late October 2002)
Compare today's report to the situation one solar rotation ago:
28 days ago
27 days ago
26 days ago
No obvious coronal holes are currently in or near Earth facing positions. A weak coronal structure is just west of region 10923, this is perhaps the remains of CH244.
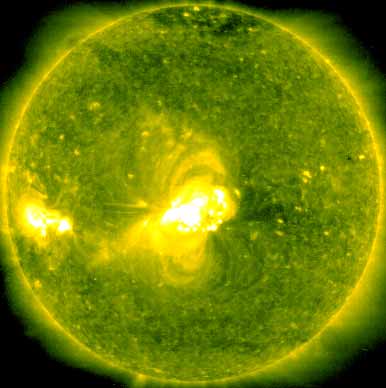
Processed SOHO/EIT 284 image at 19:06 UTC on November 14. The darkest areas on the solar disk are likely coronal holes.
The geomagnetic field is expected to be mostly quiet on November 15. The quiet conditions could extend for several more days, however, there is some uncertainty as to whether a weak stream from what was CH244 during the previous rotation could arrive on November 16-17.
| Coronal holes (1) | Coronal mass ejections (2) | M and X class flares (3) |
1) Effects from a coronal hole could reach Earth
within the next 5 days. When the high speed stream has arrived the color changes to green.
2) Effects from a CME are likely to be observed at Earth within 96 hours.
3) There is a possibility of either M or X class flares within the next 48 hours.
Green: 0-20% probability, Yellow: 20-60% probability, Red: 60-100% probability.
Long distance low and medium frequency (below 2 MHz) propagation along east-west paths over high and upper middle latitudes is fair to good. Propagation on long distance northeast-southwest paths is poor.
Monitoring remarks from a location near N58E06: Many stations from North America were audible during the night. Examples are 1380 CKLC and 1520 WWKB, both with fair to strong signals.
\
Compare to the previous day's image.
Data for all numbered solar regions according to the Solar Region Summary provided by NOAA/SEC. Comments are my own, as is the STAR spot count (spots observed at or inside a few hours before midnight) and data for regions not numbered by SEC or where SEC has observed no spots. SEC active region numbers in the table below and in the active region map above are the historic SEC/USAF numbers.
| Active region | Date numbered | SEC spot count |
STAR spot count |
Location at midnight | Area | Classification | Comment |
|---|---|---|---|---|---|---|---|
| 10923 | 2006.11.08 | 7 | 4 | S05W05 | 0660 | CKO | |
| 10924 | 2006.11.13 | 3 | 4 | S08E44 | 0040 | DSO | classification was CSO at midnight, area 0030 Location: S08E40 |
| 10925 | 2006.11.14 | 1 | 2 | S06E52 | 0100 | HAX | Location at midnight: S05E50 |
| Total spot count: | 11 | 10 | |||||
| SSN: | 41 | 40 | |||||
| Month | Average solar flux at Earth |
International sunspot number | Smoothed sunspot number |
|---|---|---|---|
| 2000.04 | 184.2 | 125.5 | 120.8 cycle 23 sunspot max. |
| 2000.07 | 202.3 | 170.1 | 119.8 |
| 2001.12 | 235.1 | 132.2 | 114.6 (-0.9) |
| 2005.08 | 90.5 | 36.4 | 27.4 (-1.7) |
| 2005.09 | 91.1 | 21.9 | 25.8 (-1.6) |
| 2005.10 | 77.0 | 8.7 | 25.5 (-0.3) |
| 2005.11 | 86.3 | 18.0 | 24.9 (-0.6) |
| 2005.12 | 90.7 | 41.1 | 23.0 (-1.9) |
| 2006.01 | 83.4 | 15.3 | 20.8 (-2.2) |
| 2006.02 | 76.5 | 4.9 | 18.6 (-2.2) |
| 2006.03 | 75.4 | 10.6 | 17.3 (-1.3) |
| 2006.04 | 89.0 | 30.2 | 17.1 (-0.2) |
| 2006.05 | 80.9 | 22.2 | (16.8 predicted, -0.3) |
| 2006.06 | 76.5 | 13.9 | (15.1 predicted, -1.7) |
| 2006.07 | 75.7 | 12.2 | (13.2 predicted, -1.9) |
| 2006.08 | 79.0 | 12.9 | (12.7 predicted, -0.5) |
| 2006.09 | 77.8 | 14.5 | (12.6 predicted, -0.1) |
| 2006.10 | 74.3 | 10.4 | (11.5 predicted, -1.1) |
| 2006.11 | 89.5 (1) | 17.1 (2) | (10.1 predicted, -1.4) |
1) Running average based on the
daily 20:00 UTC observed solar flux
value at 2800 MHz.
2) Unofficial, accumulated value based on the Boulder (NOAA/SEC)
sunspot number. The official international sunspot number is typically
30-50% lower.
This report has been prepared by Jan Alvestad. It is based partly on my own observations and analysis, and partly on data from some of these solar data sources. All time references are to the UTC day. Comments and suggestions are always welcome.
| [DX-Listeners' Club] |