
Last major update issued on May 5, 2006 at 04:10 UTC.
[Solar and
geomagnetic data - last month (updated daily)]
[Solar wind and
electron fluence charts (updated daily)]
[Solar cycles 21-23
(last update April 1, 2006)]
[Solar cycles 1-20]
[Graphical comparison
of cycles 21, 22 and 23 (last update April 1, 2006)]
[Graphical
comparison of cycles 2, 10, 13, 17, 20 and 23 (last update April 1, 2006)]
[Historical solar and
geomagnetic data charts 1954-2005 (last update March 3, 2006)]
[Archived reports (last update
May 3, 2006)]
The geomagnetic field was quiet to minor storm on May 4. Solar wind speed ranged between 293 and 338 (all day average 315) km/sec under the influence of a disturbance which began during the afternoon of May 3. Solar wind density was on average much higher than what is normally observed. The source of this disturbance could be the slow halo CMEs observed some days ago.
Solar flux measured at 20h UTC on 2.8 GHz was 91.8. The planetary A index
was 14 (STAR Ap - based on the mean of three hour interval ap
indices: 14.0).
Three hour interval K indices: 11325333 (planetary), 11334323 (Boulder).
The background x-ray flux is at the class B1 level.
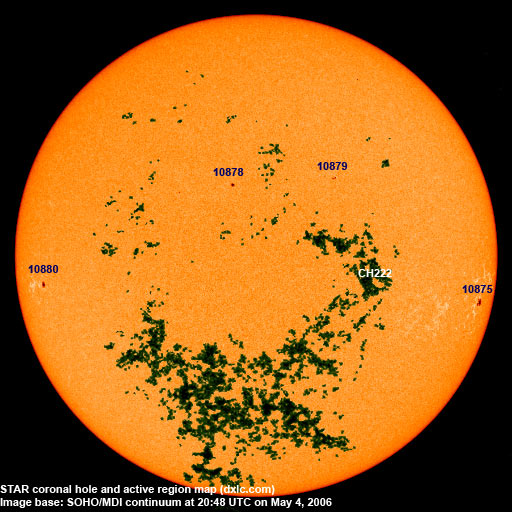
At midnight there were 4 spotted regions on the visible solar disk. The solar flare activity level was low. A single C class event was recorded during the day, a C1.1 long duration event peaking at 17:45 UTC from a source behind the southeast limb.
Region 10875 decayed slowly and quietly.
Region 10878 decayed and lost about half of the penumbral area.
Region 10879 decayed and lost the trailing spots.
New region 10880 rotated into view at the southeast limb on May 3 and was
numbered the next day by NOAA/SEC.
May 2-3: No partly or fully Earth directed CMEs were observed in LASCO
imagery.
May 4: A partial halo CME was observed in LASCO images early in the day
following a filament eruption near spotless region 10876.
Coronal hole history (since late October 2002)
Compare today's report with the situation one solar rotation ago:
28 days ago
27 days ago
26 days ago
A recurrent trans equatorial coronal hole (CH222) was in an Earth facing position on May 2-4.

Processed SOHO/EIT 284 image at 01:06 UTC on May 5. The darkest areas on the solar disk are likely coronal holes.
The geomagnetic field is expected to be unsettled to minor storm on May 5-6 due to a high speed stream from CH222, isolated major storm intervals are possible. Quiet to active conditions are likely on May 7 becoming mostly quiet on May 8-9.
| Coronal holes (1) | Coronal mass ejections (2) | M and X class flares (3) |
1) Effects from a coronal hole could reach Earth
within the next 5 days. When the high speed stream has arrived the color changes to green.
2) Effects from a CME are likely to be observed at Earth within 96 hours.
3) There is a possibility of either M or X class flares within the next 48 hours.
Green: 0-20% probability, Yellow: 20-60% probability, Red: 60-100% probability.
Long distance low and medium frequency (below 2 MHz) propagation along east-west paths over high and upper middle latitudes is poor. Propagation on long distance northeast-southwest paths is poor. Trans Atlantic propagation conditions are normally monitored every night on 1470 kHz. Tonight Radio Vibraci�n (Venezuela) and Radio Cristal del Uruguay were both audible at times. On other frequencies it was possible to hear weak signals from Brazil. WWZN on 1510 kHz was the only North American stations audible with a weak signal.
Compare to the previous day's image.
Data for all numbered solar regions according to the Solar Region Summary provided by NOAA/SEC. Comments are my own, as is the STAR spot count (spots observed at or inside a few hours before midnight) and data for regions not numbered by SEC or where SEC has observed no spots. SEC active region numbers in the table below and in the active region map above are the historic SEC/USAF numbers.
| Active region | Date numbered | SEC spot count |
STAR spot count |
Location at midnight | Area | Classification | Comment |
|---|---|---|---|---|---|---|---|
| 10875 | 2006.04.23 | 2 | 3 | S13W72 | 0160 | DHO | classification was HAX at midnight |
| 10876 | 2006.04.24 | S17W42 | plage | ||||
| 10877 | 2006.04.26 | S05W54 | plage | ||||
| 10878 | 2006.04.26 | 1 | 2 | N14E05 | 0040 | HSX | |
| 10879 | 2006.05.02 | 6 | 4 | N16W18 | 0070 | CHI | classification was CSO at midnight, area 0030 |
| 10880 | 2006.05.04 | 1 | 1 | S08E63 | 0080 | HHX | formerly region S651 classification was HAX at midnight (the SEC classification for this region, 10875 and 10879 appears to be written by someone not entirely familiar with the classification system) |
| S647 | 2006.04.29 | N08W50 | plage | ||||
| S650 | 2006.05.03 | S12E36 | plage | ||||
| Total spot count: | 10 | 10 | |||||
| SSN: | 50 | 50 | |||||
| Month | Average solar flux at Earth |
International sunspot number | Smoothed sunspot number |
|---|---|---|---|
| 2000.04 | 184.2 | 125.5 | 120.8 cycle 23 sunspot max. |
| 2000.07 | 202.3 | 170.1 | 119.8 |
| 2001.12 | 235.1 | 132.2 | 114.6 (-0.9) |
| 2005.02 | 97.2 | 29.2 | 33.9 (-0.7) |
| 2005.03 | 89.9 | 24.5 | 33.5 (-0.4) |
| 2005.04 | 86.0 | 24.2 | 31.6 (-1.9) |
| 2005.05 | 99.3 | 42.7 | 28.9 (-2.7) |
| 2005.06 | 93.7 | 39.3 | 28.8 (-0.1) |
| 2005.07 | 96.4 | 40.1 | 29.1 (+0.3) |
| 2005.08 | 90.5 | 36.4 | 27.4 (-1.7) |
| 2005.09 | 91.1 | 21.9 | 25.8 (-1.6) |
| 2005.10 | 77.0 | 8.5 | 25.5 (-0.3) |
| 2005.11 | 86.3 | 18.0 | (24.5 predicted, -1.0) |
| 2005.12 | 90.7 | 41.2 | (21.8 predicted, -2.7) |
| 2006.01 | 83.4 | 15.4 | (18.7 predicted, -3.1) |
| 2006.02 | 76.5 | 4.7 | (15.6 predicted, -3.1) |
| 2006.03 | 75.4 | 10.8 | (13.4 predicted, -2.2) |
| 2006.04 | 89.0 | 30.2 | (12.7 predicted, -0.7) |
| 2006.05 | 90.9 (1) | 6.7 (2) | (12.2 predicted, -0.5) |
1) Running average based on the
daily 20:00 UTC observed solar flux
value at 2800 MHz.
2) Unofficial, accumulated value based on the Boulder (NOAA/SEC)
sunspot number. The official international sunspot number is typically
30-50% lower.
This report has been prepared by Jan Alvestad. It is based partly on my own observations and analysis, and partly on data from some of these solar data sources. All time references are to the UTC day. Comments and suggestions are always welcome.
| [DX-Listeners' Club] |