
Last major update issued on July 23, 2006 at 05:30 UTC.
[Solar and
geomagnetic data - last month (updated daily)]
[Solar wind and
electron fluence charts (updated daily)]
[Solar cycles 21-23
(last update July 19, 2006)]
[Solar cycles 1-20]
[Graphical comparison
of cycles 21, 22 and 23 (last update July 19, 2006)]
[Graphical
comparison of cycles 2, 10, 13, 17, 20 and 23 (last update July 19, 2006)]
[Historical solar and
geomagnetic data charts 1954-2005 (last update March 3, 2006)]
[Archived reports (last update
July 9, 2006)]
The geomagnetic field was quiet on July 22. Solar wind speed ranged between 270 and 356 km/s (all day average 306 km/s - increasing 33 km/s over the previous day).
Solar flux measured at 20h UTC on 2.8 GHz was 73.6. The planetary A index
was 4 (STAR Ap - based on the mean of three hour interval ap
indices: 4.0).
Three hour interval K indices: 12111112 (planetary), 22111102 (Boulder).
The background x-ray flux is at the class A4 level.
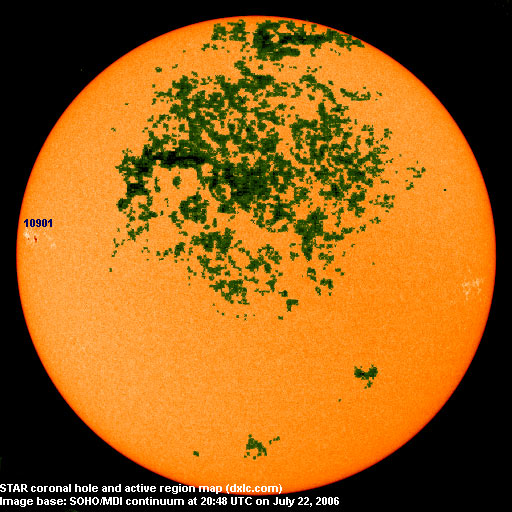
At midnight there was 1 spotted region on the visible solar disk. The solar flare activity level was very low. No C class events were recorded during the day.
New region 10901 rotated into view at the northeast limb. Polarity separation is poor and C flares are possible.
Another cycle 24 dipole emerged during the afternoon and was located at S32E03 at midnight. No spots have been observed so far.
July 21-22: No partly or fully Earth directed CMEs were detected in
LASCO
imagery.
July 20: A partial halo CME was observed after noon as a result of the
eruption of a large filament in the southeast quadrant.
Coronal hole history (since late October 2002)
Compare today's report to the situation one solar rotation ago:
28 days ago
27 days ago
26 days ago
A recurrent trans equatorial coronal hole (CH232) was in an Earth facing location on July 21-22. This coronal hole has decayed substantially over the past two solar rotations and is currently poorly defined.

Processed SOHO/EIT 284 image at 01:06 UTC on July 23. The darkest areas on the solar disk are likely coronal holes.
The geomagnetic field is expected to be quiet on July 23. The CME observed on July 20 could reach Earth during the latter half of July 23 or on July 24 and cause unsettled to active conditions. A low speed stream from CH232 could influence the geomasgnetic field on July 24-26 resulting in some unsettled intervals.
| Coronal holes (1) | Coronal mass ejections (2) | M and X class flares (3) |
1) Effects from a coronal hole could reach Earth
within the next 5 days. When the high speed stream has arrived the color changes to green.
2) Effects from a CME are likely to be observed at Earth within 96 hours.
3) There is a possibility of either M or X class flares within the next 48 hours.
Green: 0-20% probability, Yellow: 20-60% probability, Red: 60-100% probability.
Long distance low and medium frequency (below 2 MHz) propagation along east-west paths over high and upper middle latitudes is poor. Propagation on long distance northeast-southwest paths was fair to good during the night and very good during the first 90 minutes after LSR. Propagation strongly favored stations from Argentina and Uruguay with excellent signals from several stations (including 700, 710, 870, 930, 950, 1130, 1190, 1270, 1400, 1410 kHz). 1620 kHz had both Radio Vida and Radio Italia with occasional good peaks, reaching signal levels not previously heard from those stations.
Compare to the previous day's image.
Data for all numbered solar regions according to the Solar Region Summary provided by NOAA/SEC. Comments are my own, as is the STAR spot count (spots observed at or inside a few hours before midnight) and data for regions not numbered by SEC or where SEC has observed no spots. SEC active region numbers in the table below and in the active region map above are the historic SEC/USAF numbers.
| Active region | Date numbered | SEC spot count |
STAR spot count |
Location at midnight | Area | Classification | Comment |
|---|---|---|---|---|---|---|---|
| 10900 | 2006.07.14 | S06W65 | plage | ||||
| 10901 | 2006.07.22 | 6 | 7 | N06E70 | 0040 | CSO | classification was DAO at midnight, area 0060 |
| Total spot count: | 6 | 7 | |||||
| SSN: | 16 | 17 | |||||
| Month | Average solar flux at Earth |
International sunspot number | Smoothed sunspot number |
|---|---|---|---|
| 2000.04 | 184.2 | 125.5 | 120.8 cycle 23 sunspot max. |
| 2000.07 | 202.3 | 170.1 | 119.8 |
| 2001.12 | 235.1 | 132.2 | 114.6 (-0.9) |
| 2005.05 | 99.3 | 42.7 | 28.9 (-2.7) |
| 2005.06 | 93.7 | 39.3 | 28.8 (-0.1) |
| 2005.07 | 96.4 | 40.1 | 29.1 (+0.3) |
| 2005.08 | 90.5 | 36.4 | 27.4 (-1.7) |
| 2005.09 | 91.1 | 21.9 | 25.8 (-1.6) |
| 2005.10 | 77.0 | 8.5 | 25.5 (-0.3) |
| 2005.11 | 86.3 | 18.0 | 24.9 (-0.6) |
| 2005.12 | 90.7 | 41.2 | 23.0 (-1.9) |
| 2006.01 | 83.4 | 15.4 | (20.7 predicted, -2.3) |
| 2006.02 | 76.5 | 4.7 | (18.2 predicted, -2.5) |
| 2006.03 | 75.4 | 10.8 | (16.4 predicted, -1.8) |
| 2006.04 | 89.0 | 30.2 | (15.7 predicted, -0.7) |
| 2006.05 | 80.9 | 22.2 | (14.9 predicted, -0.8) |
| 2006.06 | 76.5 | 13.9 | (12.7 predicted, -2.2) |
| 2006.07 | 76.2 (1) | 17.2 (2) | (11.3 predicted, -1.4) |
1) Running average based on the
daily 20:00 UTC observed solar flux
value at 2800 MHz.
2) Unofficial, accumulated value based on the Boulder (NOAA/SEC)
sunspot number. The official international sunspot number is typically
30-50% lower.
This report has been prepared by Jan Alvestad. It is based partly on my own observations and analysis, and partly on data from some of these solar data sources. All time references are to the UTC day. Comments and suggestions are always welcome.
| [DX-Listeners' Club] |