
Last major update issued on August 20, 2006 at 05:25 UTC.
[Solar and
geomagnetic data - last month (updated daily)]
[Solar wind and
electron fluence charts (updated daily)]
[Solar cycles 21-23
(last update August 6, 2006)]
[Solar cycles 1-20]
[Graphical comparison
of cycles 21, 22 and 23 (last update August 6, 2006)]
[Graphical
comparison of cycles 2, 10, 13, 17, 20 and 23 (last update August 6, 2006)]
[Historical solar and
geomagnetic data charts 1954-2005 (last update March 3, 2006)]
[Archived reports (last update
August 6, 2006)]
The geomagnetic field was quiet to major storm on August 19. Solar wind speed ranged between 343 and 506 km/s (all day average 426 km/s - increasing 64 km/s over the previous day). While SOHO did not record a solar wind shock, ACE data indicate that the leading front of a CME passed by a few minutes before 11h UTC. This was likely the arrival of the large CME observed on August 16.
Solar flux measured at 20h UTC on 2.8 GHz was 88.8. The planetary A index
was 38 (STAR Ap - based on the mean of three hour interval ap
indices: 38.4).
Three hour interval K indices: 21126665 (planetary), 21235455 (Boulder).
The background x-ray flux is at the class B1 level.
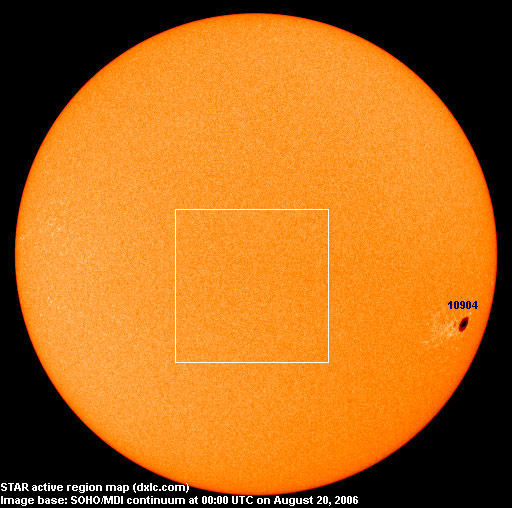
At midnight there was 1 spotted region on the visible solar disk. The solar flare activity level was low. A total of 2 C class events was recorded during the day.
Region 10904 decayed further and lost penumbra on the trailing spots. There is still a small chance of an M class flare. Flares: C3.8 at 11:24 and C2.2 at 21:19 UTC.
August 17-19: No partly or fully Earth directed CMEs were detected in LASCO imagery.
Coronal hole history (since late October 2002)
Compare today's report to the situation one solar rotation ago:
28 days ago
27 days ago
26 days ago
A small coronal hole in the southern hemisphere was probably located just too far to the south to be geoeffective, it rotated across the central meridian on August 18.

Processed SOHO/EIT 284 image at 19:08 UTC on August 18. The darkest areas on the solar disk are likely coronal holes.
The geomagnetic field is expected to be quiet to major storm on August 20 and quiet to unsettled on August 21-22.
| Coronal holes (1) | Coronal mass ejections (2) | M and X class flares (3) |
1) Effects from a coronal hole could reach Earth
within the next 5 days. When the high speed stream has arrived the color changes to green.
2) Effects from a CME are likely to be observed at Earth within 96 hours.
3) There is a possibility of either M or X class flares within the next 48 hours.
Green: 0-20% probability, Yellow: 20-60% probability, Red: 60-100% probability.
Long distance low and medium frequency (below 2 MHz) propagation along east-west paths over high and upper middle latitudes is very poor. 1510 WWZN was noted with a weak signal at LSR as the only station from North America. Propagation on long distance northeast-southwest paths is fair.While there weren't many stations from Argentina and Uruguay audible, a number of stations from Brazil had good signals. 1560 and 1570 kHz both had several stations from Brazil during the hour after LSR.
Compare to the previous day's image.
Data for all numbered solar regions according to the Solar Region Summary provided by NOAA/SEC. Comments are my own, as is the STAR spot count (spots observed at or inside a few hours before midnight) and data for regions not numbered by SEC or where SEC has observed no spots. SEC active region numbers in the table below and in the active region map above are the historic SEC/USAF numbers.
| Active region | Date numbered | SEC spot count |
STAR spot count |
Location at midnight | Area | Classification | Comment |
|---|---|---|---|---|---|---|---|
| 10904 | 2006.08.09 | 11 | 7 | S14W54 | 0540 | FKO | classification was CKO at midnight, area 0420 location: S13W59 |
| Total spot count: | 11 | 7 | |||||
| SSN: | 21 | 17 | |||||
| Month | Average solar flux at Earth |
International sunspot number | Smoothed sunspot number |
|---|---|---|---|
| 2000.04 | 184.2 | 125.5 | 120.8 cycle 23 sunspot max. |
| 2000.07 | 202.3 | 170.1 | 119.8 |
| 2001.12 | 235.1 | 132.2 | 114.6 (-0.9) |
| 2005.06 | 93.7 | 39.3 | 28.8 (-0.1) |
| 2005.07 | 96.4 | 40.1 | 29.1 (+0.3) |
| 2005.08 | 90.5 | 36.4 | 27.4 (-1.7) |
| 2005.09 | 91.1 | 21.9 | 25.8 (-1.6) |
| 2005.10 | 77.0 | 8.5 | 25.5 (-0.3) |
| 2005.11 | 86.3 | 18.0 | 24.9 (-0.6) |
| 2005.12 | 90.7 | 41.2 | 23.0 (-1.9) |
| 2006.01 | 83.4 | 15.4 | 20.8 (-2.2) |
| 2006.02 | 76.5 | 4.7 | (18.4 predicted, -2.4) |
| 2006.03 | 75.4 | 10.8 | (16.6 predicted, -1.8) |
| 2006.04 | 89.0 | 30.2 | (15.9 predicted, -0.7) |
| 2006.05 | 80.9 | 22.2 | (15.1 predicted, -0.8) |
| 2006.06 | 76.5 | 13.9 | (12.9 predicted, -2.2) |
| 2006.07 | 75.7 | 12.2 | (11.4 predicted, -1.5) |
| 2006.08 | 78.6 (1) | 12.4 (2) | (11.4 predicted, -0.0) |
1) Running average based on the
daily 20:00 UTC observed solar flux
value at 2800 MHz.
2) Unofficial, accumulated value based on the Boulder (NOAA/SEC)
sunspot number. The official international sunspot number is typically
30-50% lower.
This report has been prepared by Jan Alvestad. It is based partly on my own observations and analysis, and partly on data from some of these solar data sources. All time references are to the UTC day. Comments and suggestions are always welcome.
| [DX-Listeners' Club] |