
Last major update issued on April 29, 2006 at 05:15 UTC.
[Solar and
geomagnetic data - last month (updated daily)]
[Solar wind and
electron fluence charts (updated daily)]
[Solar cycles 21-23
(last update April 1, 2006)]
[Solar cycles 1-20]
[Graphical comparison
of cycles 21, 22 and 23 (last update April 1, 2006)]
[Graphical
comparison of cycles 2, 10, 13, 17, 20 and 23 (last update April 1, 2006)]
[Historical solar and
geomagnetic data charts 1954-2005 (last update March 3, 2006)]
[Archived reports (last update
April 3, 2006)]
The geomagnetic field was quiet to minor storm on April 28. Solar wind speed ranged between 297 and 429 (all day average 382) km/sec. A solar wind shock was observed at SOHO at 00:20 UTC. Solar wind speed increased abruptly from 300 to 340 km/sec.
Solar flux measured at 20h UTC on 2.8 GHz was 100.1. The planetary A index
was 12 (STAR Ap - based on the mean of three hour interval ap
indices: 12.5).
Three hour interval K indices: 33521122 (planetary), 33633222 (Boulder).
The background x-ray flux is at the class B2 level.
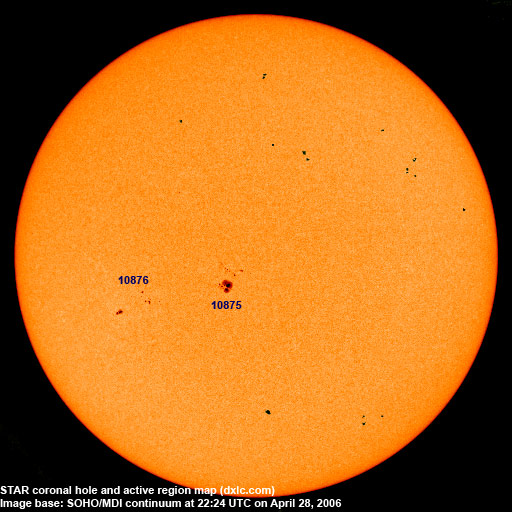
At midnight there were 2 spotted regions on the visible solar disk. The solar flare activity level was low. A total of 2 C class events was recorded during the day. A C2.3 flare at 23:36 UTC had its source in a region just behind the northeast limb.
Region 10875 decayed slowly and is magnetically not as complex as it
was a couple of days ago. Flare: C1.9 at
08:26 UTC.
Region 10876 decayed both in the leading and trailing spot sections.
April 26-28: No partly or fully Earth directed CMEs were observed in LASCO imagery.
Coronal hole history (since late October 2002)
Compare today's report with the situation one solar rotation ago:
28 days ago
27 days ago
26 days ago
No obvious coronal holes are currently in or approaching Earth facing locations.

Processed SOHO/EIT 284 image at 01:06 UTC on April 29. The darkest areas on the solar disk are likely coronal holes.
The geomagnetic field is expected to be quiet on April 29 - May 1.
| Coronal holes (1) | Coronal mass ejections (2) | M and X class flares (3) |
1) Effects from a coronal hole could reach Earth
within the next 5 days. When the high speed stream has arrived the color changes to green.
2) Effects from a CME are likely to be observed at Earth within 96 hours.
3) There is a possibility of either M or X class flares within the next 48 hours.
Green: 0-20% probability, Yellow: 20-60% probability, Red: 60-100% probability.
Long distance low and medium frequency (below 2 MHz) propagation along east-west paths over high and upper middle latitudes is poor. Propagation on long distance northeast-southwest paths is fair. Trans Atlantic propagation conditions are normally monitored every night on 1470 kHz. Several stations from North America were heard on other frequencies, 1510 WWZN was quite strong. At local sunrise propagation favored Argentina. Surprisingly Radio Provincia de Santa Cruz on 830.06 kHz had one of the better signals.
Compare to the previous day's image.
Data for all numbered solar regions according to the Solar Region Summary provided by NOAA/SEC. Comments are my own, as is the STAR spot count (spots observed at or inside a few hours before midnight) and data for regions not numbered by SEC or where SEC has observed no spots. SEC active region numbers in the table below and in the active region map above are the historic SEC/USAF numbers.
| Active region | Date numbered | SEC spot count |
STAR spot count |
Location at midnight | Area | Classification | Comment |
|---|---|---|---|---|---|---|---|
| 10875 | 2006.04.23 | 23 | 19 | S11E06 | 0380 | DAC | beta-gamma |
| 10876 | 2006.04.24 | 13 | 12 | S15E30 | 0200 | EAI | beta-gamma classification was EAO at midnight |
| 10877 | 2006.04.26 | 2 | S05E24 | 0010 | AXX | spotless | |
| Total spot count: | 38 | 31 | |||||
| SSN: | 68 | 51 | |||||
| Month | Average solar flux at Earth |
International sunspot number | Smoothed sunspot number |
|---|---|---|---|
| 2000.04 | 184.2 | 125.5 | 120.8 cycle 23 sunspot max. |
| 2000.07 | 202.3 | 170.1 | 119.8 |
| 2001.12 | 235.1 | 132.2 | 114.6 (-0.9) |
| 2005.01 | 102.2 | 31.3 | 34.6 (-0.6) |
| 2005.02 | 97.2 | 29.2 | 33.9 (-0.7) |
| 2005.03 | 89.9 | 24.5 | 33.5 (-0.4) |
| 2005.04 | 86.0 | 24.2 | 31.6 (-1.9) |
| 2005.05 | 99.3 | 42.7 | 28.9 (-2.7) |
| 2005.06 | 93.7 | 39.3 | 28.8 (-0.1) |
| 2005.07 | 96.4 | 40.1 | 29.1 (+0.3) |
| 2005.08 | 90.5 | 36.4 | 27.4 (-1.7) |
| 2005.09 | 91.1 | 21.9 | 25.8 (-1.6) |
| 2005.10 | 77.0 | 8.5 | (24.8 predicted, -1.0) |
| 2005.11 | 86.3 | 18.0 | (22.7 predicted, -2.1) |
| 2005.12 | 90.7 | 41.2 | (19.8 predicted, -2.9) |
| 2006.01 | 83.4 | 15.4 | (16.7 predicted, -3.1) |
| 2006.02 | 76.5 | 4.7 | (13.6 predicted, -3.1) |
| 2006.03 | 75.4 | 10.8 | (11.4 predicted, -2.2) |
| 2006.04 | 88.2 (1) | 51.0 (2) | (10.7 predicted, -0.7) |
1) Running average based on the
daily 20:00 UTC observed solar flux
value at 2800 MHz.
2) Unofficial, accumulated value based on the Boulder (NOAA/SEC)
sunspot number. The official international sunspot number is typically
30-50% lower.
This report has been prepared by Jan Alvestad. It is based partly on my own observations and analysis, and partly on data from some of these solar data sources. All time references are to the UTC day. Comments and suggestions are always welcome.
| [DX-Listeners' Club] |