
Last major update issued on September 14, 2005 at 02:35 UTC.
[Solar and
geomagnetic data - last month (updated daily)]
[Solar wind and
electron fluence charts (updated daily)]
[Solar cycles 21-23
(last update September 3, 2005)]
[Solar cycles 1-20]
[Graphical comparison
of cycles 21, 22 and 23 (last update September 3, 2005)]
[Graphical
comparison of cycles 2, 10, 13, 17, 20 and 23 (last update September 3,
2005)]
[Historical solar and
geomagnetic data charts 1954-2004 (last update February 1, 2005)]
[Archived reports
(last update September 2 , 2005)]
The geomagnetic field was unsettled to major storm on September 13. Solar wind speed ranged between 584 and 862 (all day average 735) km/sec.
Solar flux measured at 17h UTC on 2.8 GHz was 113.6 (the measurements at both 20 and 23h UTC were flare enhanced). The planetary
A
index was 51 (STAR Ap - based on the mean of three hour interval ap
indices: 51.1).
Three hour interval K indices: 65465344 (planetary), 55565143 (Boulder).
The background x-ray flux is at the class B7 level.
At midnight there was 1 spotted region on the visible solar disk. The solar flare activity level was high. A total of 9 C, 1 M and 3 X class events was recorded during the day.
Region 10808 displayed significant changes as the main penumbra increased its areal coverage. The negative polarity in the southern half of the penumbra is moving slowly westwards as a path has opened to the main negative polarity areas in the west. The main penumbra has positive polarity umbrae in the north as well as in the southernmost part where a few patches of positive polarity have emerged. The main penumbra is extremely complex and further X class proton flares are possible. Flares: C4.3 at 00:58, C3.4 at 03:27, C1.5 at 04:00, C1.9 at 04:18, C5.1 at 04:45 (associated with a weak type IV radio sweep), C1.2 at 06:35, C1.8 at 08:28, M1.3 at 11:21, C4.5 at 13:43, C2.9 at 19:05, impulsive X1.5 at 19:27, long duration X1.5/2B proton event peaking at 20:05 (this event was triggered by the preceding X1.5 impulsive flare and was associated with a large halo CME) and X1.7 at 23:22 UTC.
September 11: At least a partial halo CME was associated with an M3 LDE in region 10808 just after noon.
September 13: A large, fast full halo CME was associated with the X1 long duration event which peaked at 20:05 UTC in region 10808.
Coronal hole
history (since late October 2002)
Compare today's report with the situation one solar rotation ago: 28
days ago 27 days ago 26
days ago
Coronal holes cannot currently be reliably observed with GOES SXI, TRACE and SOHO data all unavailable.

Processed TRACE mosaic image on September 6, 2005. The darkest areas on the solar disk are likely coronal holes.
The geomagnetic field is expected to be unsettled to minor storm on September 14. The CME observed during the evening of September 13 could reach Earth just before midnight on September 14 or early on September 15 and cause minor to extremely severe (Kp 5-9) geomagnetic storming. Unsettled to major storm is likely on September 16 barring further CME activity in region 10808.
| Coronal holes (1) | Coronal mass ejections (2) | M and X class flares (3) |
1) Effects from a coronal hole could reach Earth
within the next 5 days. When the high speed stream has arrived
the color changes to green.
2) Material from a CME is likely to impact Earth within 96 hours.
3) There is a possibility of either M or X class flares within the next
48 hours.
Green: 0-20% probability, Yellow: 20-60% probability, Red: 60-100% probability.
Long distance low and medium frequency (below 2 MHz) propagation along east-west paths over high and upper middle latitudes is useless. Propagation on long distance northeast-southwest paths is poor to fair. Trans Atlantic propagation conditions are normally monitored every night on 1470 kHz. Dominant station tonight: Radio Cristal del Uruguay with a fair signal. Several stations from Argentina and Uruguay were noted on other frequencies. Local sunrise propagation to Argentina was again excellent on September 13 with a large number of stations audible, some of them with good to very good signals. On 780 kHz both Radio Tres in Chubut and Radio Libertador in Mendoza were present.
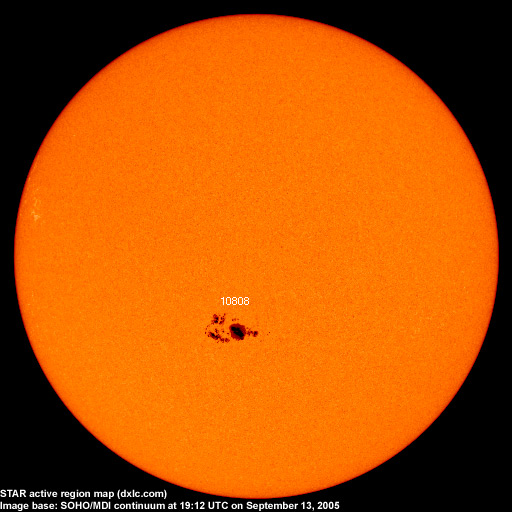
Compare to the previous day's image.
Data for all numbered solar regions according to the Solar Region Summary provided by NOAA/SEC. Comments are my own, as is the STAR spot count (spots observed at or inside a few hours before midnight) and data for regions not numbered by SEC or where SEC has observed no spots. SEC active region numbers in the table below and in the active region map above are the historic SEC/USAF numbers.
| Active region | Date numbered | SEC spot count |
STAR spot count |
Location at midnight | Area | Classification | Comment |
|---|---|---|---|---|---|---|---|
| 10808 | 2005.09.07 | 74 | 61 | S11E04 | 0840 | FKC | beta-gamma-delta |
| 10809 | 2005.09.08 | 1 | N08W08 | 0020 | HSX | spotless | |
| S591 | 2005.09.09 | S05W14 | plage | ||||
| Total spot count: | 75 | 61 | |||||
| SSN: | 95 | 71 | |||||
| Month | Average solar flux at Earth |
International sunspot number | Smoothed sunspot number |
|---|---|---|---|
| 2000.04 | 184.2 | 125.5 | 120.8 cycle 23 sunspot max. |
| 2000.07 | 202.3 | 170.1 | 119.8 |
| 2001.12 | 235.1 | 132.2 | 114.6 (-0.9) |
| 2004.07 | 119.1 | 51.1 | 40.2 (-1.4) |
| 2004.08 | 109.6 | 40.9 | 39.2 (-1.0) |
| 2004.09 | 103.1 | 27.7 | 37.5 (-1.7) |
| 2004.10 | 105.9 | 48.0 | 35.9 (-1.6) |
| 2004.11 | 113.2 | 43.5 | 35.3 (-0.6) |
| 2004.12 | 94.5 | 17.9 | 35.2 (-0.1) |
| 2005.01 | 102.2 | 31.3 | 34.6 (-0.6) |
| 2005.02 | 97.2 | 29.2 | 33.9 (-0.7) |
| 2005.03 | 89.9 | 24.5 | (33.5 predicted, -0.4) |
| 2005.04 | 86.0 | 24.4 | (32.2 predicted, -1.3) |
| 2005.05 | 99.3 | 42.6 | (29.9 predicted, -2.3) |
| 2005.06 | 93.7 | 39.6 | (28.7 predicted, -1.2) |
| 2005.07 | 96.4 | 39.9 | (27.7 predicted, -1.0) |
| 2005.08 | 90.5 | 36.4 | (25.8 predicted, -1.9) |
| 2005.09 | 92.8 (1) | 17.5 (2) | (24.2 predicted, -1.6) |
1) Running average based on the daily 20:00 UTC observed solar flux
value at 2800 MHz.
2) Unofficial, accumulated value based on the Boulder (NOAA/SEC)
sunspot number. The official international sunspot number is typically
30-50% lower.
This report has been prepared by Jan Alvestad. It is based partly on my own observations and analysis, and partly on data from some of these solar data sources. All time references are to the UTC day. Comments and suggestions are always welcome.
| [DX-Listeners' Club] |