
Last major update issued on September 2,
2005 at 06:25 UTC.
[Solar and
geomagnetic data - last month (updated daily)]
[Solar wind and
electron fluence charts (updated daily)]
[Solar cycles 21-23
(last update August 2, 2005)]
[Solar cycles 1-20]
[Graphical comparison
of cycles 21, 22 and 23 (last update August 2, 2005)]
[Graphical
comparison of cycles 2, 10, 13, 17, 20 and 23 (last update August 2,
2005)]
[Historical solar and
geomagnetic data charts 1954-2004 (last update February 1, 2005)]
[Archived reports
(last update September 2 , 2005)]
The geomagnetic field was quiet to minor storm on September 1. Solar wind speed ranged between 445 and 579 (all day average 510) km/sec under the influence of a high speed stream from CH184.
Solar flux measured at 20h UTC on 2.8 GHz was 79.2. The planetary
A
index was 21 (STAR Ap - based on the mean of three hour interval ap
indices: 21.1).
Three hour interval K indices: 55334222 (planetary), 56334112 (Boulder).
The background x-ray flux is at the class A4 level.
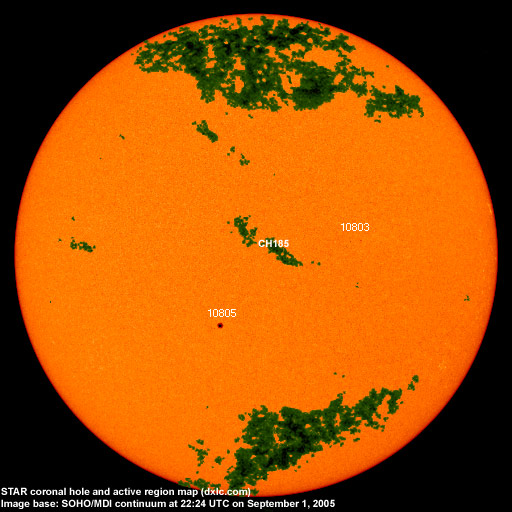
At midnight there were 2 spotted regions on the visible solar disk. The solar flare activity level was very low. No C class events were recorded during the day.
Region 10803 reemerged with a couple small spots.
Region 10805 was quiet and stable.
Energetic protons are still enhanced above background levels because of the giant backsided eruption on August 31, that eruption was associated with one of the brightest CMEs observed.
August 30 and September 1: No obvious partly or fully Earth directed CMEs were
observed.
August 31: A faint full halo CME was observed in LASCO images following the long duration C2 event in region 10803 at noon. An
extremely bright "mother-of-all-CMEs" full halo CME was observed in LASCO C3 images beginning at 23:18 UTC. Its source
was backsided, about 6 days behind the southwest limb.
Coronal hole
history (since late October 2002)
Compare today's report with the situation one solar rotation ago: 28
days ago 27 days ago 26
days ago
A recurrent coronal hole (CH184) in the southern hemisphere was in an Earth facing position on August 27-28. A small recurrent coronal hole (CH185) in the northern hemisphere will likely rotate to an Earth facing position on September 1-2. CH185 did not cause any obvious disturbance during the previous rotation.

Processed SOHO/EIT 284 image at 19:06 UTC on September 1. The darkest areas on the solar disk are likely coronal holes.
The geomagnetic field is expected to be quiet to active on September 2 due to a high speed stream from CH184. The halo CME observed at noon on August 31 could reach Earth early on September 3 and cause unsettled to minor storm conditions. Quiet to active is likely on September 4 becoming quiet to unsettled on September 5-6.
| Coronal holes (1) | Coronal mass ejections (2) | M and X class flares (3) |
1) Effects from a coronal hole could reach Earth
within the next 5 days. When the high speed stream has arrived
the color changes to green.
2) Material from a CME is likely to impact Earth within 96 hours.
3) There is a possibility of either M or X class flares within the next
48 hours.
Green: 0-20% probability, Yellow: 20-60% probability, Red: 60-100% probability.
Long distance low and medium frequency (below 2 MHz) propagation along east-west paths over high and upper middle latitudes is very poor. Propagation on long distance northeast-southwest paths is fair to good. Trans Atlantic propagation conditions are normally monitored every night on 1470 kHz. Dominant stations tonight: Radio Cristal del Uruguay and LT28 Rafaela Argentina. Propagation to Uruguay and Argentina was good about 30 minutes after LSR with 710 Radio Diez and 950 Radio Belgrano becoming strong in peaks. Radio Sport (Uruguay) was fair on 890 kHz and several other stations were noted, some of them on frequencies not often heard with audio. Some stations from Venezuela were audible after LSR as well while the Peruvians on 1470 and 1499.93 kHz had fair peaks just before LSR.
Compare to the previous day's image.
Data for all numbered solar regions according to the Solar Region Summary provided by NOAA/SEC. Comments are my own, as is the STAR spot count (spots observed at or inside a few hours before midnight) and data for regions not numbered by SEC or where SEC has observed no spots. SEC active region numbers in the table below and in the active region map above are the historic SEC/USAF numbers.
| Active region | Date numbered | SEC spot count |
STAR spot count |
Location at midnight | Area | Classification | Comment |
|---|---|---|---|---|---|---|---|
| 10803 | 2005.08.24 | 2 | N11W26 | 0010 | BXO | ||
| 10804 | 2005.08.25 | N11W78 | plage | ||||
| 10805 | 2005.08.27 | 2 | 2 | S10E08 | 0070 | HSX | classification was CSO at midnight |
| 10806 | 2005.08.29 | 2 | S16E07 | 0010 | HRX | spotless | |
| S588 | 2005.08.31 | N12E16 | plage | ||||
| S589 | 2005.08.31 | S23W59 | plage | ||||
| Total spot count: | 4 | 4 | |||||
| SSN: | 24 | 24 | |||||
| Month | Average solar flux at Earth |
International sunspot number | Smoothed sunspot number |
|---|---|---|---|
| 2000.04 | 184.2 | 125.5 | 120.8 cycle 23 sunspot max. |
| 2000.07 | 202.3 | 170.1 | 119.8 |
| 2001.12 | 235.1 | 132.2 | 114.6 (-0.9) |
| 2004.07 | 119.1 | 51.1 | 40.2 (-1.4) |
| 2004.08 | 109.6 | 40.9 | 39.2 (-1.0) |
| 2004.09 | 103.1 | 27.7 | 37.5 (-1.7) |
| 2004.10 | 105.9 | 48.0 | 35.9 (-1.6) |
| 2004.11 | 113.2 | 43.5 | 35.3 (-0.6) |
| 2004.12 | 94.5 | 17.9 | 35.2 (-0.1) |
| 2005.01 | 102.2 | 31.3 | 34.6 (-0.6) |
| 2005.02 | 97.2 | 29.2 | 33.9 (-0.7) |
| 2005.03 | 89.9 | 24.5 | (33.5 predicted, -0.4) |
| 2005.04 | 86.0 | 24.4 | (32.2 predicted, -1.3) |
| 2005.05 | 99.3 | 42.6 | (29.9 predicted, -2.3) |
| 2005.06 | 93.7 | 39.6 | (28.7 predicted, -1.2) |
| 2005.07 | 96.4 | 39.9 | (27.7 predicted, -1.0) |
| 2005.08 | 90.5 | 36.4 | (25.8 predicted, -1.9) |
| 2005.09 | 79.2 (1) | 0.8 (2) | (24.2 predicted, -1.6) |
1) Running average based on the daily 20:00 UTC observed solar flux
value at 2800 MHz.
2) Unofficial, accumulated value based on the Boulder (NOAA/SEC)
sunspot number. The official international sunspot number is typically
30-50% lower.
This report has been prepared by Jan Alvestad. It is based partly on my own observations and analysis, and partly on data from some of these solar data sources. All time references are to the UTC day. Comments and suggestions are always welcome.
| [DX-Listeners' Club] |