
Last major update issued on May 15, 2005 at 05:15 UTC.
[Solar and
geomagnetic data - last month (updated daily)]
[Solar wind and
electron fluence charts (updated daily)]
[Solar cycles 21-23
(last update May 6, 2005)]
[Solar cycles 1-20]
[Graphical comparison
of cycles 21, 22 and 23 (last update May 6, 2005)]
[Graphical
comparison of cycles 2, 10, 13, 17, 20 and 23 (last update May 6, 2005)]
[Historical solar and
geomagnetic data charts 1954-2004 (last update February 1, 2005)]
[Archived reports
(last update May 2, 2005)]
The geomagnetic field was quiet to unsettled on May 14. Solar wind speed ranged between 390 and 559 km/sec. A weak coronal hole stream became the dominant solar wind source during the last hours of the day, earlier in the day the solar wind was more complex and it is difficult to determine its sources. A strong solar wind shock was observed at SOHO at 02:18 UTC when wind speed increased suddenly from 514 to 971 km/sec. This was the arrival of the CME observed at 17h UTC on May 13, a transit time of only 33 hours. The interplanetary magnetic field has initially been somewhat confused with no strong southerly excursions observed yet. The geomagnetic field is currently at minor to major storm levels. A very strong increase in proton levels was observed when the CME reached Earth, the above 10 MeV proton flux peaked near 3000 pfu.
Solar flux measured at 20h UTC on 2.8 GHz was 99.5. The planetary
A
index was 8 (STAR Ap - based on the mean of three hour interval ap
indices: 7.5).
Three hour interval K indices: 21322222 (planetary), 12223222 (Boulder).
The background x-ray flux is at the class B7 level.
At midnight there were 3 spotted regions on the visible solar disk. The solar flare activity level was low. A total of 6 C class events was recorded during the day.
Region 10758 rotated out of view at the southwest limb. The region became more active during the day and produced several
flares. Flares: C1.1 at 13:26, C4.0 at 15:06, C3.5 at 15:57 and a long duration C2.8
event peaking at 20:58 UTC. A strong type II radio sweep was associated with the latter event.
Region 10759 decayed and lost about half of the spots outside of the main penumbra. Another M class flare is still
possible.
Region 10762 decayed quickly and was quiet.
Region 10763 was mostly unchanged and still has a weak magnetic delta structure in the trailing penumbra.
May 12 and 14: No obviously fully or partly potentially geoeffective CMEs were observed.
May 13: A
bright and fast CME aimed directly at Earth was first observed in LASCO C2 images at 17:22 and in C3 at 17:42 UTC and was
associated with the major M8 proton flare in region 10759. The propagation of the shock wave on and near the solar surface was
extremely impressive in EIT 195 images.
Coronal hole
history (since late October 2002)
Compare today's report with the situation one solar rotation ago: 28
days ago 27 days ago 26
days ago
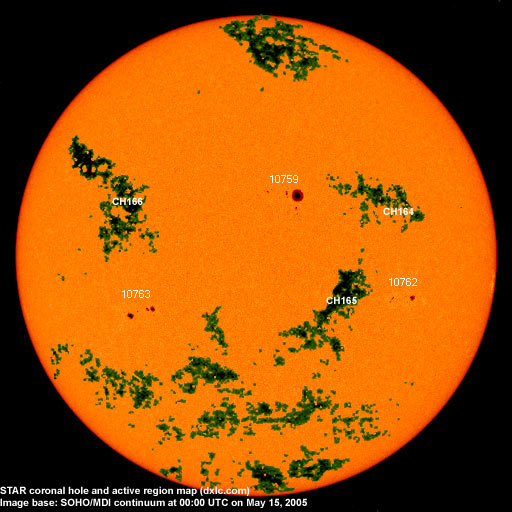
A poorly defined coronal hole (CH164) in the northern hemisphere near the equator was in an Earth facing position on May 10-12. A new coronal hole (CH165) formed in the southern hemisphere when corona was blown away by the M8 flare on May 13, CH165 was in an Earth facing position on May 13-14. A recurrent coronal hole (CH166) in the northern hemisphere will likely be in an Earth facing position on May 17.
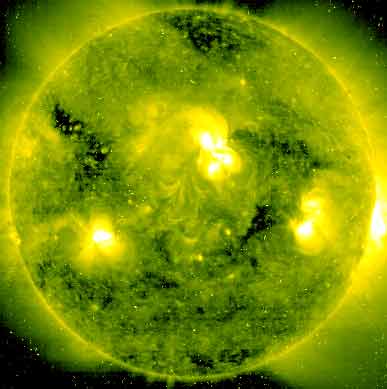
Processed SOHO/EIT 284 image at 01:06 UTC on May 15. The darkest areas on the solar disk are likely coronal holes.
The geomagnetic field is expected be minor to severe storm on May 15, quiet to minor storm on May 16 and quiet to unsettled on May 17.
| Coronal holes (1) | Coronal mass ejections (2) | M and X class flares (3) |
1) Effects from a coronal hole could reach Earth
within the next 5 days. When the high speed stream has arrived
the color changes to green.
2) Material from a CME is likely to impact Earth within 96 hours.
3) There is a possibility of either M or X class flares within the next
48 hours.
Green: 0-20% probability, Yellow: 20-60% probability, Red: 60-100% probability.
Long distance low and medium frequency (below 2 MHz) propagation along east-west paths over high and upper middle latitudes is very poor. Propagation along long distance north-south paths is poor. Trans Atlantic propagation conditions are normally monitored every night on 1470 kHz. Dominant station tonight: Radio Cristal del Uruguay. WWZN on 1510 kHz had a fair signal prior to the arrival of the CME, then the signal disappeared suddenly.
Compare to the previous day's image.
Data for all numbered solar regions according to the Solar Region Summary provided by NOAA/SEC. Comments are my own, as is the STAR spot count (spots observed at or inside a few hours before midnight) and data for regions not numbered by SEC or where SEC has observed no spots. SEC active region numbers in the table below and in the active region map above are the historic SEC/USAF numbers.
| Active region | Date numbered | SEC spot count |
STAR spot count |
Location at midnight | Area | Classification | Comment |
|---|---|---|---|---|---|---|---|
| 10758 | 2005.05.02 | 3 | S10W90 | 0150 | HAX | rotated out of view | |
| 10759 | 2005.05.08 | 22 | 12 | N11W07 | 0350 | DHI | |
| 10762 | 2005.05.10 | 13 | 9 | S12W37 | 0090 | DAO | area was 0070 at midnight |
| 10763 | 2005.05.12 | 13 | 13 | S16E31 | 0130 | DAO | beta-gamma-delta |
| Total spot count: | 51 | 34 | |||||
| SSN: | 91 | 64 | |||||
| Month | Average solar flux at Earth |
International sunspot number | Smoothed sunspot number |
|---|---|---|---|
| 2000.04 | 184.2 | 125.5 | 120.8 cycle 23 sunspot max. |
| 2000.07 | 202.3 | 170.1 | 119.8 |
| 2001.12 | 235.1 | 132.2 | 114.6 (-0.9) |
| 2004.03 | 112.0 | 49.1 | 47.1 (-2.2) |
| 2004.04 | 101.2 | 39.3 | 45.5 (-1.6) |
| 2004.05 | 99.8 | 41.5 | 43.8 (-1.7) |
| 2004.06 | 97.4 | 43.2 | 41.6 (-2.2) |
| 2004.07 | 119.1 | 51.1 | 40.2 (-1.4) |
| 2004.08 | 109.6 | 40.9 | 39.2 (-1.0) |
| 2004.09 | 103.1 | 27.7 | 37.5 (-1.7) |
| 2004.10 | 105.9 | 48.0 | 35.9 (-1.6) |
| 2004.11 | 113.2 | 43.5 | (34.8 predicted, -1.1) |
| 2004.12 | 94.5 | 17.9 | (33.4 predicted, -1.4) |
| 2005.01 | 102.2 | 31.3 | (30.9 predicted, -2.5) |
| 2005.02 | 97.2 | 29.1 | (28.3 predicted, -2.6) |
| 2005.03 | 89.9 | 24.8 | (26.5 predicted, -1.8) |
| 2005.04 | 86.0 | 24.4 | (24.6 predicted, -1.9) |
| 2005.05 | 110.9 (1) | 36.6 (2) | (22.0 predicted, -2.6) |
1) Running average based on the daily 20:00 UTC observed solar flux
value at 2800 MHz.
2) Unofficial, accumulated value based on the Boulder (NOAA/SEC)
sunspot number. The official international sunspot number is typically
30-50% less.
This report has been prepared by Jan Alvestad. It is based partly on my own observations and analysis, and partly on data from some of these solar data sources. All time references are to the UTC day. Comments and suggestions are always welcome.
| [DX-Listeners' Club] |