
Last major update issued on May 10, 2005 at 03:40 UTC.
[Solar and
geomagnetic data - last month (updated daily)]
[Solar wind and
electron fluence charts (updated daily)]
[Solar cycles 21-23
(last update May 6, 2005)]
[Solar cycles 1-20]
[Graphical comparison
of cycles 21, 22 and 23 (last update May 6, 2005)]
[Graphical
comparison of cycles 2, 10, 13, 17, 20 and 23 (last update May 6, 2005)]
[Historical solar and
geomagnetic data charts 1954-2004 (last update February 1, 2005)]
[Archived reports
(last update May 2, 2005)]
The geomagnetic field was quiet to active on May 9. Solar wind speed ranged between 502 and 704 km/sec. During the latter half of the day the high speed stream from CH163 gradually replaced the recent CME as the main solar wind factor.
Solar flux measured at 20h UTC on 2.8 GHz was 110.0. The planetary
A
index was 11 (STAR Ap - based on the mean of three hour interval ap
indices: 11.4).
Three hour interval K indices: 33111234 (planetary), 33122223 (Boulder).
The background x-ray flux is at the class B7 level.
At midnight there were 5 spotted regions on the visible solar disk. The solar flare activity level was low. A total of 9 C class events was recorded during the day.
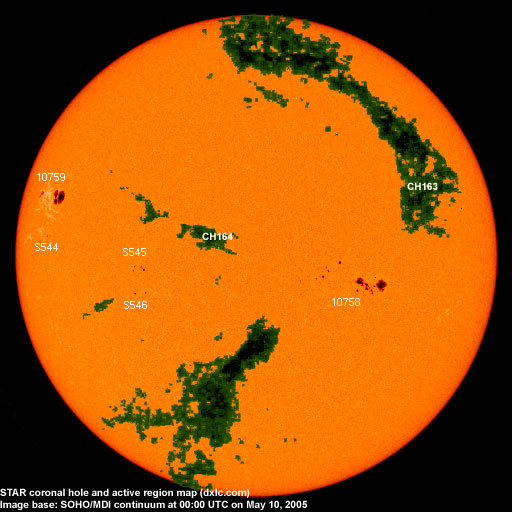
Region 10758 lost quite a few spots as the leading and intermediate spot sections became more compact and added penumbral
area. There's a weak magnetic delta structure in the southeastern part of the largest intermediate penumbra. An M class flare is possible. Flares:
C2.8 at 03:37, C1.4 at 10:08, C8.9 at 11:03, C5.6 at 11:46, C2.5 at 12:31 and C1.8 at 12:43 UTC.
Region 10759 changed with the leading penumbra splitting off two penumbrae, one in the southeast and the other in the
northeast. In a rather unusual magnetic field configuration a narrow strip of negative polarity is separating the three positive
polarity penumbrae. M flares are possible. Flares: C3.7 at 21:09, C2.7 at 23:05 and C2.7 at
23:35 UTC.
Spotted regions not numbered by NOAA/SEC:
[S544] This region rotated into view at the northeast limb on May 8. Location at midnight: N03E60.
[S545] A new region emerged in the southeast quadrant on May 9. Location at midnight: S06E28.
[S546] A new region emerged in the southeast quadrant on May 9 just south of region S545. Location at midnight: S12E28.
May 7-9: No obviously fully or partly potentially geoeffective CMEs were observed.
Coronal hole
history (since late October 2002)
Compare today's report with the situation one solar rotation ago: 28
days ago 27 days ago 26 days ago
A large recurrent coronal hole (CH163) in the northern hemisphere was in an Earth facing position on May 6-7. A small coronal hole in the northern hemisphere near the equator will be in an Earth facing position on May 10-11.
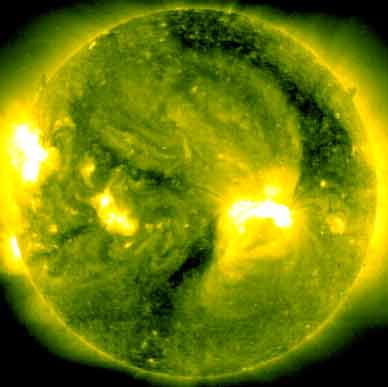
Processed SOHO/EIT 284 image at 01:06 UTC on May 10. The darkest areas on the solar disk are likely coronal holes.
The geomagnetic field is expected be quiet to active on May 10 due to a high speed stream from CH163 and quiet to unsettled on May 11-12. Quiet to active is possible on May 13-14 due to a low speed stream from CH164.
| Coronal holes (1) | Coronal mass ejections (2) | M and X class flares (3) |
1) Effects from a coronal hole could reach Earth
within the next 5 days. When the high speed stream has arrived
the color changes to green.
2) Material from a CME is likely to impact Earth within 96 hours.
3) There is a possibility of either M or X class flares within the next
48 hours.
Green: 0-20% probability, Yellow: 20-60% probability, Red: 60-100% probability.
Long distance low and medium frequency (below 2 MHz) propagation along east-west paths over high and upper middle latitudes is poor. Propagation along long distance north-south paths is poor. Trans Atlantic propagation conditions are normally monitored every night on 1470 kHz. Dominant stations tonight: Radio Cristal del Uruguay and CPN Radio (Per�). R�dio Cristal (Brazil) on 1350 kHz had the best signal of the observed trans Atlantic stations. From North America both WWZN on 1510 and WWRU on 1660 were audible.
Compare to the previous day's image.
Data for all numbered solar regions according to the Solar Region Summary provided by NOAA/SEC. Comments are my own, as is the STAR spot count (spots observed at or inside a few hours before midnight) and data for regions not numbered by SEC or where SEC has observed no spots. SEC active region numbers in the table below and in the active region map above are the historic SEC/USAF numbers.
SEC active region data for May 9 was unavailable at the time of this report.
| Active region | Date numbered | SEC spot count |
STAR spot count |
Location at midnight | Area | Classification | Comment |
|---|---|---|---|---|---|---|---|
| 10758 | 2005.05.02 | 51 | 32 | S08W13 | 0500 | FKI |
beta-gamma-delta |
| 10759 | 2005.05.08 | 8 | 10 | N12E60 | 0430 | EKO | |
| S544 | visible on 2005.05.08 |
1 | N03E60 | 0010 | AXX | ||
| S545 | emerged on 2005.05.09 |
7 | S06E28 | 0030 | CSO | ||
| S546 | emerged on 2005.05.09 |
3 | S12E28 | 0030 | DSO | ||
| Total spot count: | 66 | 53 | |||||
| SSN: | 106 | 103 | |||||
| Month | Average solar flux at Earth |
International sunspot number | Smoothed sunspot number |
|---|---|---|---|
| 2000.04 | 184.2 | 125.5 | 120.8 cycle 23 sunspot max. |
| 2000.07 | 202.3 | 170.1 | 119.8 |
| 2001.12 | 235.1 | 132.2 | 114.6 (-0.9) |
| 2004.03 | 112.0 | 49.1 | 47.1 (-2.2) |
| 2004.04 | 101.2 | 39.3 | 45.5 (-1.6) |
| 2004.05 | 99.8 | 41.5 | 43.8 (-1.7) |
| 2004.06 | 97.4 | 43.2 | 41.6 (-2.2) |
| 2004.07 | 119.1 | 51.1 | 40.2 (-1.4) |
| 2004.08 | 109.6 | 40.9 | 39.2 (-1.0) |
| 2004.09 | 103.1 | 27.7 | 37.5 (-1.7) |
| 2004.10 | 105.9 | 48.0 | 35.9 (-1.6) |
| 2004.11 | 113.2 | 43.5 | (34.8 predicted, -1.1) |
| 2004.12 | 94.5 | 17.9 | (33.4 predicted, -1.4) |
| 2005.01 | 102.2 | 31.3 | (30.9 predicted, -2.5) |
| 2005.02 | 97.2 | 29.1 | (28.3 predicted, -2.6) |
| 2005.03 | 89.9 | 24.8 | (26.5 predicted, -1.8) |
| 2005.04 | 86.0 | 24.4 | (24.6 predicted, -1.9) |
| 2005.05 | 108.6 (1) | 19.7 (2) | (22.0 predicted, -2.6) |
1) Running average based on the daily 20:00 UTC observed solar flux
value at 2800 MHz.
2) Unofficial, accumulated value based on the Boulder (NOAA/SEC)
sunspot number. The official international sunspot number is typically
30-50% less.
This report has been prepared by Jan Alvestad. It is based partly on my own observations and analysis, and partly on data from some of these solar data sources. All time references are to the UTC day. Comments and suggestions are always welcome.
| [DX-Listeners' Club] |