
Last major update issued on May 2, 2005 at 02:40 UTC.
[Solar and
geomagnetic data - last month (updated daily)]
[Solar wind and
electron fluence charts (updated daily)]
[Solar cycles 21-23
(last update April 4, 2005)]
[Solar cycles 1-20]
[Graphical comparison
of cycles 21, 22 and 23 (last update April 4, 2005)]
[Graphical
comparison of cycles 2, 10, 13, 17, 20 and 23 (last update April 4, 2005)]
[Historical solar and
geomagnetic data charts 1954-2004 (last update February 1, 2005)]
[Archived reports
(last update May 2, 2005)]
The geomagnetic field was quiet to major storm on May 1. Solar wind speed ranged between 528 and 705 km/sec under the influence of a high speed stream from CH162.
Solar flux measured at 20h UTC on 2.8 GHz was 111.6. The planetary
A
index was 26 (STAR Ap - based on the mean of three hour interval ap
indices: 26.3).
Three hour interval K indices: 56433332 (planetary), 55433332 (Boulder).
The background x-ray flux is at the class B3 level.
At midnight there were 2 spotted regions on the visible solar disk. The solar flare activity level was low. A total of 2 C class events was recorded during the day. A fairly active region behind the southeast limb was the source of both events, a long duration C1.9 event peaking at 16:38 and a long duration C2.1 event beginning on May 1 and peaking at 00:04 UTC on May 2.
Region 10756 decayed slightly and became more compact. An M class flare is still possible.
Region 10757 decayed losing several small spots.
April 29: No obvious fully or partly Earth
directed CMEs
were observed.
April 30: A faint full halo CME was observed in LASCO C3 images beginning at 17:18 UTC. No obvious frontside activity was
observed during the hours before this, and the source was likely backsided.
May 1: A brighter full halo CME was observed in LASCO C3 images beginning at 01:42 UTC. Considerable large scale reshaping
of the corona to the south of region 10756 was observed late on April 30 and early on May 1. However, since I couldn't observe any
significant eruptive event or a disappearing filament during the relevant time frame, it is at this time uncertain if the CME was
backsided (with the same source as the CME observed on April 30) or had its origin near region 10756.
Coronal hole
history (since late October 2002)
Compare today's report with the situation one solar rotation ago: 28
days ago 27 days ago 26 days ago
A recurrent coronal hole (CH162) in the northern hemisphere was in an Earth facing position on April 27-29.
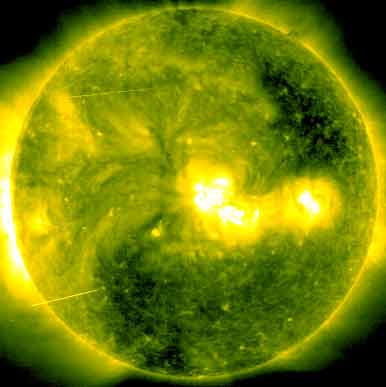
Processed SOHO/EIT 284 image at 01:06 UTC on May 2. The darkest areas on the solar disk are likely coronal holes.
The geomagnetic field is expected be quiet to unsettled on May 2-4. If the CME observed early on May 1 was caused by activity on the visible disk, a CME impact will be possible on May 3.
| Coronal holes (1) | Coronal mass ejections (2) | M and X class flares (3) |
1) Effects from a coronal hole could reach Earth
within the next 5 days. When the high speed stream has arrived
the color changes to green.
2) Material from a CME is likely to impact Earth within 96 hours.
3) There is a possibility of either M or X class flares within the next
48 hours.
Green: 0-20% probability, Yellow: 20-60% probability, Red: 60-100% probability.
Long distance low and medium frequency (below 2 MHz) propagation along east-west paths over high and upper middle latitudes is very poor. Propagation along long distance north-south paths is poor to fair. Trans Atlantic propagation conditions are normally monitored every night on 1470 kHz. Dominant stations tonight: Radio Cristal del Uruguay and Radio Rafaela (Argentina). The strongest trans Atlantic signal noted was from Radio Am�rica (Argentina) on 1190 kHz.

Compare to the previous day's image.
Data for all numbered solar regions according to the Solar Region Summary provided by NOAA/SEC. Comments are my own, as is the STAR spot count (spots observed at or inside a few hours before midnight) and data for regions not numbered by SEC or where SEC has observed no spots. SEC active region numbers in the table below and in the active region map above are the historic SEC/USAF numbers.
| Active region | Date numbered | SEC spot count |
STAR spot count |
Location at midnight | Area | Classification | Comment |
|---|---|---|---|---|---|---|---|
| 10756 | 2005.04.25 | 33 | 32 | S06W11 | 0810 | EKC |
beta-delta classification was DKC at midnight location: S08W12 |
| 10757 | 2005.04.28 | 8 | 7 | S06W38 | 0100 | DAO | location: S07W37 |
| S540 | emerged on 2005.04.28 |
S10W19 | plage | ||||
| S541 | emerged on 2005.04.29 |
S15E14 | plage | ||||
| Total spot count: | 41 | 39 | |||||
| SSN: | 61 | 59 | |||||
| Month | Average solar flux at Earth |
International sunspot number | Smoothed sunspot number |
|---|---|---|---|
| 2000.04 | 184.2 | 125.5 | 120.8 cycle 23 sunspot max. |
| 2000.07 | 202.3 | 170.1 | 119.8 |
| 2001.12 | 235.1 | 132.2 | 114.6 (-0.9) |
| 2004.03 | 112.0 | 49.1 | 47.1 (-2.2) |
| 2004.04 | 101.2 | 39.3 | 45.5 (-1.6) |
| 2004.05 | 99.8 | 41.5 | 43.8 (-1.7) |
| 2004.06 | 97.4 | 43.2 | 41.6 (-2.2) |
| 2004.07 | 119.1 | 51.1 | 40.2 (-1.4) |
| 2004.08 | 109.6 | 40.9 | 39.2 (-1.0) |
| 2004.09 | 103.1 | 27.7 | 37.5 (-1.7) |
| 2004.10 | 105.9 | 48.0 | 35.9 (-1.6) |
| 2004.11 | 113.2 | 43.5 | (34.8 predicted, -1.1) |
| 2004.12 | 94.5 | 17.9 | (33.4 predicted, -1.4) |
| 2005.01 | 102.2 | 31.3 | (30.9 predicted, -2.5) |
| 2005.02 | 97.2 | 29.1 | (28.3 predicted, -2.6) |
| 2005.03 | 89.9 | 24.8 | (26.5 predicted, -1.8) |
| 2005.04 | 86.0 | 24.4 | (24.6 predicted, -1.9) |
| 2005.05 | 111.6 (1) | 2.0 (2) | (22.0 predicted, -2.6) |
1) Running average based on the daily 20:00 UTC observed solar flux
value at 2800 MHz.
2) Unofficial, accumulated value based on the Boulder (NOAA/SEC)
sunspot number. The official international sunspot number is typically
30-50% less.
This report has been prepared by Jan Alvestad. It is based partly on my own observations and analysis, and partly on data from some of these solar data sources. All time references are to the UTC day. Comments and suggestions are always welcome.
| [DX-Listeners' Club] |