
Last major update issued on June 11, 2005 at 04:35 UTC.
[Solar and
geomagnetic data - last month (updated daily)]
[Solar wind and
electron fluence charts (updated daily)]
[Solar cycles 21-23
(last update June 4, 2005)]
[Solar cycles 1-20]
[Graphical comparison
of cycles 21, 22 and 23 (last update June 4, 2005)]
[Graphical
comparison of cycles 2, 10, 13, 17, 20 and 23 (last update June 4, 2005)]
[Historical solar and
geomagnetic data charts 1954-2004 (last update February 1, 2005)]
[Archived reports
(last update June 4, 2005)]
The geomagnetic field was very quiet to quiet on June 10. Solar wind speed ranged between 308 and 353 km/sec.
Solar flux measured at 20h UTC on 2.8 GHz was 114.7. The planetary
A
index was 5 (STAR Ap - based on the mean of three hour interval ap
indices: 4.6).
Three hour interval K indices: 21111112 (planetary), 11111211 (Boulder).
The background x-ray flux is at the class B1-B2 level.
At midnight there were 5 spotted regions on the visible solar disk. The solar flare activity level was low. A total of 1 C class event was recorded during the day.
Region 10772 rotated to the southwest limb. Flare: C2.0 at 03:10 UTC.
Region 10773 decayed slowly and lost the leader spot.
Region 10775 decayed and became less complex with no magnetic delta structures remaining.
Region 10776 did not change significantly and remains capable of producing an M class flare.
New region 10777 emerged near the northeast limb on June 9 and was numbered by SEC the next day.
June 9-10: No obvious fully or partly Earth directed CMEs were observed in LASCO images.
June 8: At least a partial halo CME was observed in LASCO C3 images during the late afternoon and early evening. The
ejected material was first observed over the southwest limb and was likely related to a filament eruption to the north of region
10772.
Coronal hole
history (since late October 2002)
Compare today's report with the situation one solar rotation ago: 28
days ago 27 days ago 26
days ago
No obvious coronal holes are currently near Earth facing positions.

Processed SOHO/EIT 284 image at 01:06 UTC on June 6. The darkest areas on the solar disk are likely coronal holes.
The geomagnetic field is expected to be quiet to unsettled most of June 11. The CME observed on June 8 could reach Earth late on June 11 or early on June 12 and cause unsettled to active conditions. Quiet to unsettled is likely on June 13-14.
| Coronal holes (1) | Coronal mass ejections (2) | M and X class flares (3) |
1) Effects from a coronal hole could reach Earth
within the next 5 days. When the high speed stream has arrived
the color changes to green.
2) Material from a CME is likely to impact Earth within 96 hours.
3) There is a possibility of either M or X class flares within the next
48 hours.
Green: 0-20% probability, Yellow: 20-60% probability, Red: 60-100% probability.
Long distance low and medium frequency (below 2 MHz) propagation along east-west paths over high and upper middle latitudes is poor. Propagation along long distance north-south paths is poor. Trans Atlantic propagation conditions are normally monitored every night on 1470 kHz. Dominant station tonight: Radio Cristal del Uruguay. On 1510 kHz both Radio Rinc�n (Uruguay) and Radio Champaqu� (Argentina) were audible at times. WDHP on 1620 and WWRU on 1660 had weak to fair signals during the half hour before local sunrise.
Compare to the previous day's image.
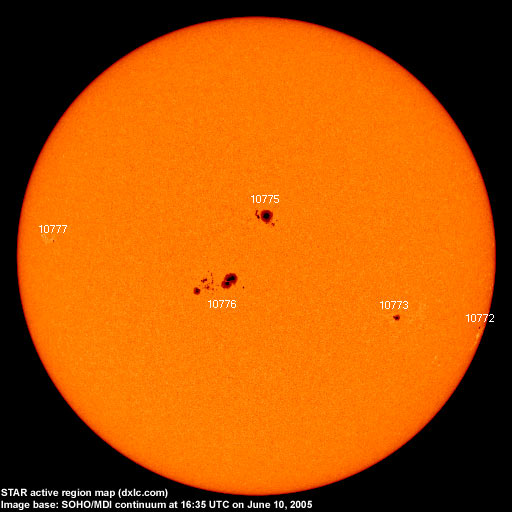
Data for all numbered solar regions according to the Solar Region Summary provided by NOAA/SEC. Comments are my own, as is the STAR spot count (spots observed at or inside a few hours before midnight) and data for regions not numbered by SEC or where SEC has observed no spots. SEC active region numbers in the table below and in the active region map above are the historic SEC/USAF numbers.
| Active region | Date numbered | SEC spot count |
STAR spot count |
Location at midnight | Area | Classification | Comment |
|---|---|---|---|---|---|---|---|
| 10769 | 2005.05.28 | S06W83 | plage | ||||
| 10772 | 2005.05.31 | 2 | 1 | S18W84 | 0060 | DSO | classification was HSX at midnight, area 0020 |
| 10773 | 2005.06.01 | 4 | 2 | S14W44 | 0070 | CSO | classification was HAX at midnight, location: S14W41 |
| 10775 | 2005.06.04 | 17 | 18 | N08W05 | 0330 | DKC |
beta-gamma
location: N10W06 |
| 10776 | 2005.06.05 | 26 | 34 | S06E07 | 0580 | EKC |
beta-gamma classification was EKI at midnight |
| 10777 | 2005.06.10 | 4 | 1 | N05E57 | 0030 | BXO |
formerly region S557 classification was HRX at midnight, area 0010, location: N05E52 |
| S555 | 2005.06.07 | S03W40 | plage | ||||
| S556 | 2005.06.09 | N05W08 | plage | ||||
| Total spot count: | 53 | 56 | |||||
| SSN: | 103 | 106 | |||||
| Month | Average solar flux at Earth |
International sunspot number | Smoothed sunspot number |
|---|---|---|---|
| 2000.04 | 184.2 | 125.5 | 120.8 cycle 23 sunspot max. |
| 2000.07 | 202.3 | 170.1 | 119.8 |
| 2001.12 | 235.1 | 132.2 | 114.6 (-0.9) |
| 2004.04 | 101.2 | 39.3 | 45.5 (-1.6) |
| 2004.05 | 99.8 | 41.5 | 43.8 (-1.7) |
| 2004.06 | 97.4 | 43.2 | 41.6 (-2.2) |
| 2004.07 | 119.1 | 51.1 | 40.2 (-1.4) |
| 2004.08 | 109.6 | 40.9 | 39.2 (-1.0) |
| 2004.09 | 103.1 | 27.7 | 37.5 (-1.7) |
| 2004.10 | 105.9 | 48.0 | 35.9 (-1.6) |
| 2004.11 | 113.2 | 43.5 | 35.3 (-0.6) |
| 2004.12 | 94.5 | 17.9 | (34.8 predicted, -0.5) |
| 2005.01 | 102.2 | 31.3 | (32.8 predicted, -2.0) |
| 2005.02 | 97.2 | 29.1 | (30.4 predicted, -2.4) |
| 2005.03 | 89.9 | 24.8 | (28.8 predicted, -1.6) |
| 2005.04 | 86.0 | 24.4 | (26.9 predicted, -1.9) |
| 2005.05 | 99.3 | 42.6 | (24.3 predicted, -2.6) |
| 2005.06 | 104.8 (1) | 28.5 (2) | (22.8 predicted, -1.5) |
1) Running average based on the daily 20:00 UTC observed solar flux
value at 2800 MHz.
2) Unofficial, accumulated value based on the Boulder (NOAA/SEC)
sunspot number. The official international sunspot number is typically
30-50% less.
This report has been prepared by Jan Alvestad. It is based partly on my own observations and analysis, and partly on data from some of these solar data sources. All time references are to the UTC day. Comments and suggestions are always welcome.
| [DX-Listeners' Club] |