
Last major update issued on July 7, 2005 at 04:55 UTC.
[Solar and
geomagnetic data - last month (updated daily)]
[Solar wind and
electron fluence charts (updated daily)]
[Solar cycles 21-23
(last update July 2, 2005)]
[Solar cycles 1-20]
[Graphical comparison
of cycles 21, 22 and 23 (last update July 2, 2005)]
[Graphical
comparison of cycles 2, 10, 13, 17, 20 and 23 (last update July 2, 2005)]
[Historical solar and
geomagnetic data charts 1954-2004 (last update February 1, 2005)]
[Archived reports
(last update July 2, 2005)]
The geomagnetic field was quiet on July 6. Solar wind speed ranged between 348 and 412 (all day average 366) km/sec.
Solar flux measured at 20h UTC on 2.8 GHz was 123.0. The planetary
A
index was 5 (STAR Ap - based on the mean of three hour interval ap
indices: 5.1).
Three hour interval K indices: 11112222 (planetary), 11211211 (Boulder).
The background x-ray flux is at the class B3 level.
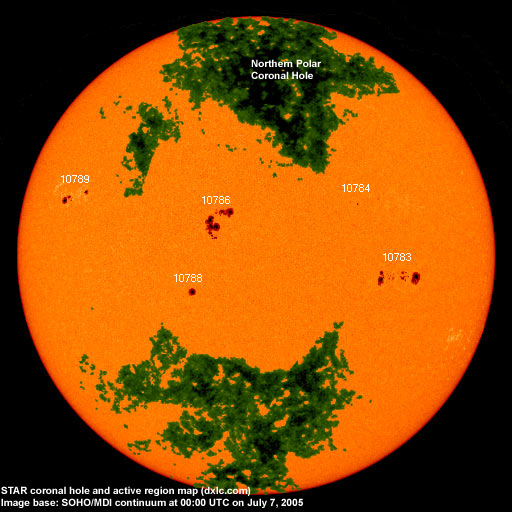
At midnight there were 5 spotted regions on the visible solar disk. The solar flare activity level was low. A total of 9 C class events was recorded during the day.
Region 10783 added several small spots and became somewhat more complex magnetically in the central spot section. A minor
M class flare is possible.
Region 10784 decayed slowly and quietly.
Region 10786 developed further and has a moderately large magnetic delta structure in the large trialing penumbra. There's
another magnetic delta in the northernmost penumbra. An M class flare is possible, perhaps even a major flare. Flares:
C2.5 at 08:49, C1.0 at 09:28, C1.4 at 13:06, C1.0 at 13:18, C1.4 at 16:06, C5.9 at 17:49, C1.4 at 18:46, C1.0 at 20:22 and C1.0 at
21:24 UTC.
Region 10788 was quiet and stable.
Region 10789 became more complex as new positive polarity flux emerged just northwest of the trailing penumbra. Further
development could cause a magnetic delta structure to form.
July 7: At least a partial halo CME was observed over the northern limbs and the north pole early in the day. The source
of this CME is not yet obvious and may have been backsided.
July 4 and 6: No obvious fully or partly Earth directed CMEs were observed in available LASCO images.
July 5: A faint full halo CME was observed beginning at 16:18 UTC in LASCO C3 images when material was first
observed over the southeast limb.
Coronal hole
history (since late October 2002)
Compare today's report with the situation one solar rotation ago: 28
days ago 27 days ago 26
days ago
An extension of a coronal hole (CH174) in the southern hemisphere may have been in an Earth facing position on July 5-6.

Processed SOHO/EIT 284 image at 01:06 UTC on July 7. The darkest areas on the solar disk are likely coronal holes.
The geomagnetic field is expected to be quiet on July 7 becoming quiet to active on July 8-9 due to a weak stream from CH174 and possibly effects from a CME observed on July 5.
| Coronal holes (1) | Coronal mass ejections (2) | M and X class flares (3) |
1) Effects from a coronal hole could reach Earth
within the next 5 days. When the high speed stream has arrived
the color changes to green.
2) Material from a CME is likely to impact Earth within 96 hours.
3) There is a possibility of either M or X class flares within the next
48 hours.
Green: 0-20% probability, Yellow: 20-60% probability, Red: 60-100% probability.
Long distance low and medium frequency (below 2 MHz) propagation along east-west paths over high and upper middle latitudes is poor. Propagation along long distance north-south paths is good. Trans Atlantic propagation conditions are normally monitored every night on 1470 kHz. Dominant stations tonight: Radio Cristal del Uruguay and Radio Vibraci�n (Venezuela). Propagation towards Argentina, Uruguay and southern Brazil improved remarkably after 02:30 UTC with lots of stations noted throughout the MW band. Radio San Carlos (Uruguay) on 1510 kHz had a nice signal, as did Radio Am�rica (Argentina) on 1190 and Radio Monte Carlo (Uruguay) on 930 kHz. From North America the Newfoundland stations on 620 and 930 kHz and WWZN on 1510 had poor to fair signals.
Compare to the previous day's image.
Data for all numbered solar regions according to the Solar Region Summary provided by NOAA/SEC. Comments are my own, as is the STAR spot count (spots observed at or inside a few hours before midnight) and data for regions not numbered by SEC or where SEC has observed no spots. SEC active region numbers in the table below and in the active region map above are the historic SEC/USAF numbers.
| Active region | Date numbered | SEC spot count |
STAR spot count |
Location at midnight | Area | Classification | Comment |
|---|---|---|---|---|---|---|---|
| 10781 | 2005.06.27 | 5 | N14W39 | 0020 | CSO | spotless | |
| 10782 | 2005.06.29 | 1 | S17W85 | 0060 | AXX | rotated out of view | |
| 10783 | 2005.06.29 | 24 | 38 | S03W36 | 0410 | EHC | classification was EKI at midnight |
| 10784 | 2005.06.29 | 1 | 3 | N15W26 | 0010 | HSX | classification was BXO at midnight |
| 10785 | 2005.06.30 | S19W59 | plage | ||||
| 10786 | 2005.07.01 | 25 | 30 | N11E10 | 0370 | DKC |
beta-gamma-delta area was 0750 at midnight |
| 10787 | 2005.07.01 | 1 | S16W87 | 0060 | HAX | very strange data from SEC, region was spotless the previous day and rotated out of view | |
| 10788 | 2005.07.02 | 1 | 1 | S07E17 | 0070 | HSX | |
| 10789 | 2005.07.03 | 5 | 10 | N17E53 | 0130 | EAO |
beta-gamma classification was DAO at midnight, area 0180 |
| S563 | 2005.06.27 | N10W69 | plage | ||||
| S567 | 2005.07.03 | S07E24 | plage | ||||
| Total spot count: | 63 | 82 | |||||
| SSN: | 143 | 132 | |||||
| Month | Average solar flux at Earth |
International sunspot number | Smoothed sunspot number |
|---|---|---|---|
| 2000.04 | 184.2 | 125.5 | 120.8 cycle 23 sunspot max. |
| 2000.07 | 202.3 | 170.1 | 119.8 |
| 2001.12 | 235.1 | 132.2 | 114.6 (-0.9) |
| 2004.05 | 99.8 | 41.5 | 43.8 (-1.7) |
| 2004.06 | 97.4 | 43.2 | 41.6 (-2.2) |
| 2004.07 | 119.1 | 51.1 | 40.2 (-1.4) |
| 2004.08 | 109.6 | 40.9 | 39.2 (-1.0) |
| 2004.09 | 103.1 | 27.7 | 37.5 (-1.7) |
| 2004.10 | 105.9 | 48.0 | 35.9 (-1.6) |
| 2004.11 | 113.2 | 43.5 | 35.3 (-0.6) |
| 2004.12 | 94.5 | 17.9 | 35.2 (-0.1) |
| 2005.01 | 102.2 | 31.3 | (34.6 predicted, -0.6) |
| 2005.02 | 97.2 | 29.1 | (33.3 predicted, -1.3) |
| 2005.03 | 89.9 | 24.8 | (31.6 predicted, -1.7) |
| 2005.04 | 86.0 | 24.4 | (29.7 predicted, -1.9) |
| 2005.05 | 99.3 | 42.6 | (27.2 predicted, -2.5) |
| 2005.06 | 93.7 | 39.3 | (25.7 predicted, -1.5) |
| 2005.07 | 123.6 (1) | 31.8 (2) | (24.7 predicted, -1.0) |
1) Running average based on the daily 20:00 UTC observed solar flux
value at 2800 MHz.
2) Unofficial, accumulated value based on the Boulder (NOAA/SEC)
sunspot number. The official international sunspot number is typically
30-50% lower.
This report has been prepared by Jan Alvestad. It is based partly on my own observations and analysis, and partly on data from some of these solar data sources. All time references are to the UTC day. Comments and suggestions are always welcome.
| [DX-Listeners' Club] |