
Last major update issued on January 21,
2005 at 04:45 UTC. Last minor update posted at 19:30 UTC.
[Solar and
geomagnetic data - last month (updated daily)]
[Solar wind and
electron fluence charts (updated daily)]
[Solar cycles 21-23
(last update January 2, 2005)]
[Solar cycles 1-20]
[Graphical comparison
of cycles 21, 22 and 23 (last update January 2, 2005)]
[Graphical
comparison of cycles 2, 10, 13, 17, 20 and 23 (last update January
2, 2005)]
[Historical solar and
geomagnetic data charts 1954-2004 (last update November 8,
2004)]
[Archived reports
(last update January 19, 2005)]
The geomagnetic field was quiet to active on January 20. Solar wind speed ranged between 459 and 1000 km/sec (these values are questionable and may be invalid due to the proton storm). Other solar wind parameters indicate that the solar wind is still extremely disturbed.
Solar flux measured at 20h UTC on 2.8 GHz was 122.7. The planetary
A
index was 12 (STAR Ap - based on the mean of three hour interval ap
indices: 12.4).
Three hour interval K indices: 21124433 (planetary), 21123433 (Boulder).
The background x-ray flux is at the class B9 level.
At midnight there were 4 spotted regions on the visible solar disk. The solar flare activity level was high. A total of 5 C and 1 X class events was recorded during the day.
Region 10720 lost some area in the main penumbra, however, the region is still very complex with multiple magnetic delta structures including a very strong delta in the main penumbra. Further major flares are possible until the region rotates 1-2 days behind the northwest limb. Flares: C1.6 at 00:47, C4.8 at 03:30, long duration major X7.1/2B proton event peaking at 07:01 (associated with moderate type II and IV radio sweeps), C8.0 at 16:14, C3.6 at 18:16 and C4.5 at 21:53 UTC.Spotted regions not numbered by NOAA/SEC:
S501: This region emerged in the southeast quadrant on
January 19 and developed slowly on January 20. Location at midnight: S02E38.
S502: This region emerged in the southwest quadrant on
January 20 and has shown quick initial development. Location at midnight: S05W25.
Comment added at 18:54 UTC on January 21: A very strong solar wind shock was observed at SOHO at 16:48 UTC. Wind speed increased abruptly from 570 to nearly 950 km/sec. This was the arrival of the huge halo CME associated with the X7 proton flare in region 10720 at 07h on January 20. Geomagnetic storming began immediately when the CME impacted Earth with the planetary A index for the 15-18 UTC interval reaching 179 (= Kp 8 - very severe storm).
Comment added at 19:30 UTC: The interplanetary A index for the 16-19 UTC interval was 207. An exceptional northern lights display can currently be observed over large parts of North Europe. At my location huge red, green and intense blue-white colored bands can be observed, not only to the north but in the southern parts of the visible sky as well.
January 20: A full halo CME was observed after the X7 event in
region 10720 at 07h UTC. While the major parts of this CME are not aimed at Earth, we could still observe a substantial impact
late on January 21 or on January 22.
January 19: A full halo CME was observed after the X1 event in
region 10720 during the morning. This CME could reach Earth
on January 21 as expansion speed in the direction of Earth was much
slower than towards the northwest.
January 18: No obvious fully or partly Earth directed CMEs
were observed.
Coronal hole
history (since late October 2002)
Compare today's report with the situation one solar rotation ago: 28
days ago 27 days ago 26 days ago
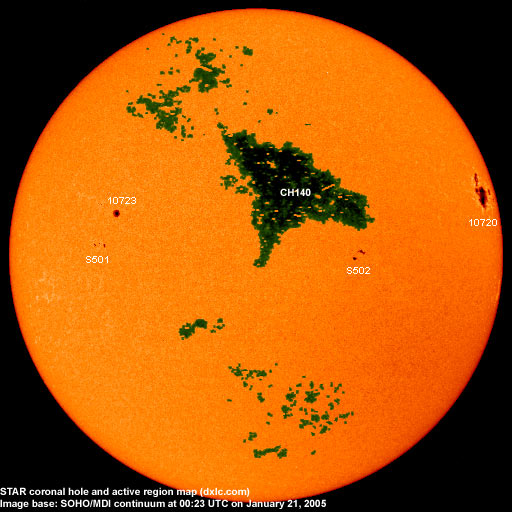
A fairly large delta shaped recurrent coronal hole (CH140) in the northern hemisphere was in a geoeffective position on January 18-20. The associated high speed stream will likely become geoeffective on January 21.

Processed SOHO/EIT 284 image at 21:50 UTC on January 20. The darkest areas on the solar disk are likely coronal holes.
The geomagnetic field is expected to be quiet to major storm on January 21-22 due to CME effects.
The high speed stream from coronal hole CH140 could arrive
late on January 21 and will probably cause unsettled to minor storm
conditions on January 22-23.
| Coronal holes (1) | Coronal mass ejections (2) | M and X class flares (3) |
1) Effects from a coronal hole could reach Earth
within the next 5 days. When the high speed stream has arrived
the color changes to green.
2) Material from a CME is likely to impact Earth within 96 hours.
3) There is a possibility of either M or X class flares within the next
48 hours.
Green: 0-20% probability, Yellow: 20-60% probability, Red: 60-100% probability.
Long distance low and medium frequency (below 2 MHz) propagation
along
east-west paths over high and upper middle latitudes is poor to fair.
Propagation along long distance north-south paths is poor to very poor.
Trans
Atlantic propagation conditions are normally monitored every night on
1470 kHz. Dominant stations tonight: Radio Cristal del Uruguay and Radio Vibraci�n (Venezuela), both with poor signals.
Propagation was interesting on other frequencies, particularly above 1350 kHz. Quite a few stations from the USA could be heard,
1510 kHz had both WWZN Boston and WLAC Nashville at the same fair signal level, 1700 kHz had WJCC and an unidentified station
playing mostly contemporary music. On 1660 kHz WWRU was the best signal, however, two other stations were audible as well.
Compare to the previous day's image.
Data for all numbered solar regions according to the Solar Region Summary provided by NOAA/SEC. Comments are my own, as is the STAR spot count (spots observed at or inside a few hours before midnight) and data for regions not numbered by SEC or where SEC has observed no spots. SEC active region numbers in the table below and in the active region map above are the historic SEC/USAF numbers.
| Active region | Date numbered | SEC spot count |
STAR spot count |
Location at midnight | Area | Classification | Comment |
|---|---|---|---|---|---|---|---|
| 10718 | 2005.01.07 | 3 | S07W88 | 0100 | CSO | rotated out of view | |
| 10720 | 2005.01.10 | 27 | 30 | N14W70 | 1400 | EKC | beta-gamma-delta |
| 10721 | 2005.01.16 | S03W37 | plage | ||||
| 10722 | 2005.01.16 | N19W51 | plage | ||||
| 10723 | 2005.01.17 | 1 | 2 | N06E35 | 0080 | HSX | classification was CSO at midnight |
| 10724 | 2005.01.18 | S12W33 | |||||
| S494 | emerged on 2005.01.13 |
S01W82 | plage | ||||
| S495 | visible on 2005.01.13 |
S06E04 | plage | ||||
| S500 | visible on 2005.01.18 |
N10E44 | plage | ||||
| S501 | emerged on 2005.01.19 |
5 | S02E38 | 0030 | DSO | ||
| S502 | emerged on 2005.01.20 |
7 | S05W25 | 0050 | DAO | ||
| Total spot count: | 31 | 44 | |||||
| SSN: | 61 | 94 | |||||
| Month | Average solar flux at Earth |
International sunspot number | Smoothed sunspot number |
|---|---|---|---|
| 2000.04 | 184.2 | 125.5 | 120.8 cycle 23 sunspot max. |
| 2000.07 | 202.3 | 170.1 | 119.8 |
| 2001.12 | 235.1 | 132.2 | 114.6 (-0.9) |
| 2003.11 | 140.8 | 67.3 | 56.7 (-1.5) |
| 2003.12 | 114.9 | 46.5 | 54.8 (-1.9) |
| 2004.01 | 114.1 | 37.3 | 52.0 (-2.8) |
| 2004.02 | 107.0 | 45.8 | 49.3 (-2.7) |
| 2004.03 | 112.0 | 49.1 | 47.1 (-2.2) |
| 2004.04 | 101.2 | 39.3 | 45.5 (-1.6) |
| 2004.05 | 99.8 | 41.5 | 43.9 (-1.6) |
| 2004.06 | 97.4 | 43.2 | 41.7 (-2.2) |
| 2004.07 | 119.1 | 51.0 | (39.6 predicted, -1.9) |
| 2004.08 | 109.6 | 40.9 | (38.0 predicted, -1.6) |
| 2004.09 | 103.1 | 27.7 | (36.1 predicted, -1.9) |
| 2004.10 | 105.9 | 48.4 | (33.9 predicted, -2.2) |
| 2004.11 | 113.2 | 43.7 | (32.0 predicted, -1.9) |
| 2004.12 | 94.5 | 17.9 | (29.7 predicted, -2.3) |
| 2005.01 | 107.5 (1) | 35.4 (2) | (27.0 predicted, -2.7) |
1) Running average based on the daily 20:00 UTC observed solar flux
value at 2800 MHz.
2) Unofficial, accumulated value based on the Boulder (NOAA/SEC)
sunspot number. The official international sunspot number is typically
30-50% less.
This report has been prepared by Jan Alvestad. It is based partly on my own observations and analysis, and partly on data from some of these solar data sources. All time references are to the UTC day. Comments and suggestions are always welcome.
| [DX-Listeners' Club] |