
Last major update issued on February 3, 2005 at 03:40 UTC. The next update will be on February 7 as I will be away during the weekend.
[Solar and
geomagnetic data - last month (updated daily)]
[Solar wind and
electron fluence charts (updated daily)]
[Solar cycles 21-23
(last update January 2, 2005)]
[Solar cycles 1-20]
[Graphical comparison
of cycles 21, 22 and 23 (last update January 2, 2005)]
[Graphical
comparison of cycles 2, 10, 13, 17, 20 and 23 (last update January
2, 2005)]
[Historical solar and
geomagnetic data charts 1954-2004 (last update February 1, 2005)]
[Archived reports
(last update February 1, 2005)]
The geomagnetic field was very quiet to unsettled on February 2. Solar wind speed ranged between 448 and 565 km/sec. The total field of the interplanetary magnetic field and solar wind density decreased noticeably at ACE near 0930 UTC, at the same time a solar wind temperature and speed increased. The source of this weak disturbance may be an unidentified coronal hole.
Solar flux measured at 20h UTC on 2.8 GHz was 81.8. The planetary
A
index was 8 (STAR Ap - based on the mean of three hour interval ap
indices: 7.9).
Three hour interval K indices: 11322231 (planetary), 12222331 (Boulder).
The background x-ray flux is at the class A6 level.
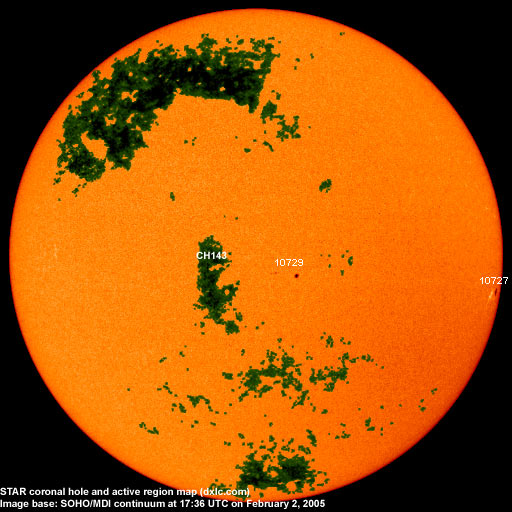
At midnight there were 2 spotted regions on the visible solar disk. The solar flare activity level was very low. No C class events were recorded during the day. Two regions just behind the southeast limb could increase flare activity over the next few days when they rotate into view.
Region 10727 was quiet and stable and will rotate out of view early on February 3.January 31-February 2: No obvious fully or partly Earth directed CMEs were observed. A full halo CME observed near noon on February 1 had a source behind the northeast limb, possibly in returning old region 10720. CMEs observed on February 2 likely had their origin in backsided southern hemisphere sources.
Coronal hole
history (since late October 2002)
Compare today's report with the situation one solar rotation ago: 28
days ago 27 days ago 26 days ago
A small recurrent coronal hole (CH143) in the southern hemisphere will likely rotate to a geoeffective position on February 3. CH143 has been decaying slowly over the last few days and could close completely before reaching a geoeffective position.

Processed SOHO/EIT 284 image at 19:06 UTC on February 2. The darkest areas on the solar disk are likely coronal holes.
The geomagnetic field is expected to be quiet to unsettled on February 3-5. A low speed stream from coronal hole CH143 could reach Earth on February 6 and cause a few unsettled and active intervals.
| Coronal holes (1) | Coronal mass ejections (2) | M and X class flares (3) |
1) Effects from a coronal hole could reach Earth
within the next 5 days. When the high speed stream has arrived
the color changes to green.
2) Material from a CME is likely to impact Earth within 96 hours.
3) There is a possibility of either M or X class flares within the next
48 hours.
Green: 0-20% probability, Yellow: 20-60% probability, Red: 60-100% probability.
Long distance low and medium frequency (below 2 MHz) propagation along east-west paths over high and upper middle latitudes is fair to good. Propagation along long distance north-south paths is very poor. Trans Atlantic propagation conditions are normally monitored every night on 1470 kHz. Dominant stations tonight: WLAM Lewiston ME with a fair signal. Many stations from North America were heard on other frequencies. 850 kHz had both WEEI Boston MA and WFTL West Palm Beach FL with good signals, 1080 had WTIC Hartford CT way over co-channel stations from Spain while most of the New York 50 kW stations had pretty strong signals.
Compare to the previous day's image.
Data for all numbered solar regions according to the Solar Region Summary provided by NOAA/SEC. Comments are my own, as is the STAR spot count (spots observed at or inside a few hours before midnight) and data for regions not numbered by SEC or where SEC has observed no spots. SEC active region numbers in the table below and in the active region map above are the historic SEC/USAF numbers.
| Active region | Date numbered | SEC spot count |
STAR spot count |
Location at midnight | Area | Classification | Comment |
|---|---|---|---|---|---|---|---|
| 10727 | 2005.01.24 | 1 | 1 | S08W84 | 0090 | HAX | |
| 10728 | 2005.01.25 | S11W38 | plage | ||||
| 10729 | 2005.01.31 | 7 | 6 | S10W10 | 0060 | DAO | classification was CSO at midnight, area 0040 |
| Total spot count: | 8 | 7 | |||||
| SSN: | 28 | 27 | |||||
| Month | Average solar flux at Earth |
International sunspot number | Smoothed sunspot number |
|---|---|---|---|
| 2000.04 | 184.2 | 125.5 | 120.8 cycle 23 sunspot max. |
| 2000.07 | 202.3 | 170.1 | 119.8 |
| 2001.12 | 235.1 | 132.2 | 114.6 (-0.9) |
| 2003.12 | 114.9 | 46.5 | 54.8 (-1.9) |
| 2004.01 | 114.1 | 37.3 | 52.0 (-2.8) |
| 2004.02 | 107.0 | 45.8 | 49.3 (-2.7) |
| 2004.03 | 112.0 | 49.1 | 47.1 (-2.2) |
| 2004.04 | 101.2 | 39.3 | 45.5 (-1.6) |
| 2004.05 | 99.8 | 41.5 | 43.9 (-1.6) |
| 2004.06 | 97.4 | 43.2 | 41.7 (-2.2) |
| 2004.07 | 119.1 | 51.0 | 40.3 (-1.4) |
| 2004.08 | 109.6 | 40.9 | (38.9 predicted, -1.4) |
| 2004.09 | 103.1 | 27.7 | (36.6 predicted, -2.3) |
| 2004.10 | 105.9 | 48.4 | (34.4 predicted, -2.2) |
| 2004.11 | 113.2 | 43.7 | (32.5 predicted, -1.9) |
| 2004.12 | 94.5 | 17.9 | (30.2 predicted, -2.3) |
| 2005.01 | 102.2 | 31.3 | (27.6 predicted, -2.6) |
| 2005.02 | 82.8 (1) | 2.0 (2) | (25.2 predicted, -2.4) |
1) Running average based on the daily 20:00 UTC observed solar flux
value at 2800 MHz.
2) Unofficial, accumulated value based on the Boulder (NOAA/SEC)
sunspot number. The official international sunspot number is typically
30-50% less.
This report has been prepared by Jan Alvestad. It is based partly on my own observations and analysis, and partly on data from some of these solar data sources. All time references are to the UTC day. Comments and suggestions are always welcome.
| [DX-Listeners' Club] |