
Last major update issued on December 5, 2005 at 05:20 UTC.
[Solar
and
geomagnetic data - last month (updated daily)]
[Solar
wind and
electron fluence charts (updated daily)]
[Solar
cycles 21-23
(last update November 9, 2005)]
[Solar
cycles 1-20]
[Graphical
comparison
of cycles 21, 22 and 23 (last update November 9, 2005)]
[Graphical
comparison of cycles 2, 10, 13, 17, 20 and 23 (last update November 9,
2005)]
[Historical
solar and
geomagnetic data charts 1954-2004 (last update February 1, 2005)]
[Archived
reports
(last update December 3, 2005)]
The geomagnetic field was inactive to quiet on December 4. Solar wind speed ranged between 507 and 689 (all day average 580) km/sec under the decreasing influence of a high speed stream from CH200.
Solar flux measured at 20h UTC
on 2.8 GHz was 95.2. The planetary
A
index was 5 (STAR Ap - based on the mean of three hour interval ap
indices: 4.9)
Three hour interval K indices: 10012121 (planetary), 42133322 (Boulder).
The background x-ray flux is at the class B1 level.
At midnight there were 5 spotted regions on the visible solar disk. The solar flare activity level was low. A total of 1 C class event was recorded during the day.
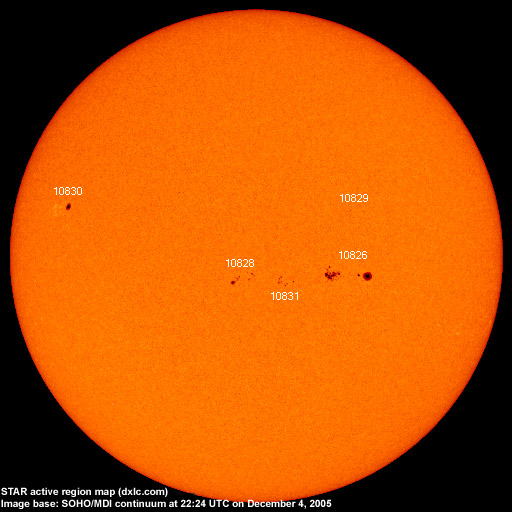
Region 10826
decayed further and was mostly quiet. Flare: C2.1/1F long
duration event peaking at 09:45 UTC.
Region 10828 decayed and lost about half of the penumbral coverage in the trailing spot section.
Region 10829 decayed further and is likely to become spotless today.
Region 10830 was quiet and stable.
New region 10831 emerged between regions 10826 and 10828.
December 3-4:
No LASCO images available.
December 2: None of the major events in region 10826 produced other than possibly very small CMEs. The unavailability of
LASCO images covering the hours after the M class event during the last hours of the day makes it difficult to confirm if there
was any CME caused by this event.
Coronal
hole
history (since late October 2002)
Compare today's report with the
situation one solar rotation ago: 28
days ago 27 days ago 26
days ago
No obvious coronal holes are currently in or near Earth facing positions.

Processed SOHO/EIT 284 image at 13:06 UTC on December 2. The darkest areas on the solar disk are likely coronal holes.
The geomagnetic field is expected to be quiet to unsettled on December 5-7.
| Coronal holes (1) | Coronal mass ejections (2) | M and X class flares (3) |
1) Effects from a coronal hole could reach
Earth
within the next 5 days. When the high speed stream has arrived
the color changes to green.
2) Material from a CME is likely to impact Earth within 96 hours.
3) There is a possibility of either M or X class flares within the next
48 hours.
Green: 0-20% probability, Yellow: 20-60% probability, Red: 60-100% probability.
Long distance low and medium frequency (below 2 MHz) propagation along east-west paths over high and upper middle latitudes is fair. Propagation on long distance northeast-southwest paths is poor. Trans Atlantic propagation conditions are normally monitored every night on 1470 kHz. Dominant stations tonight: Radio Vibración (Venezuela) and WWNN Pompano Beach FL. A number of stations from the easternmost parts of the USA were noted with fair to good signals, one example is WAMG Dedham MA on 890 kHz with ESPN Boston programming.
Compare to the previous day's image.
Data for all numbered solar regions according to the Solar Region Summary provided by NOAA/SEC. Comments are my own, as is the STAR spot count (spots observed at or inside a few hours before midnight) and data for regions not numbered by SEC or where SEC has observed no spots. SEC active region numbers in the table below and in the active region map above are the historic SEC/USAF numbers.
| Active region | Date numbered | SEC spot count |
STAR spot count |
Location at midnight | Area | Classification | Comment |
|---|---|---|---|---|---|---|---|
| 10826 | 2005.11.28 | 25 | 26 | S04W21 | 0380 | EKC | beta-gamma classification was EKI at midnight |
| 10827 | 2005.11.30 | N08E03 | plage | ||||
| 10828 | 2005.12.01 | 9 | 11 | S04E04 | 0060 | CSO | location: S05E17 |
| 10829 | 2005.12.02 | 1 | 1 | N10W26 | 0010 | AXX | |
| 10830 | 2005.12.02 | 3 | 1 | N13E51 | 0100 | CAO | classification was HSX at midnight, area 0070 location: N12E49 |
| 10831 | 2005.12.04 | 3 | 12 | S06W07 | 0030 | DSO | classification was DRI at midnight |
| S611 | 2005.12.02 | S13W24 | plage | ||||
| Total spot count: | 41 | 51 | |||||
| SSN: | 91 | 101 | |||||
| Month | Average solar flux at Earth |
International sunspot number | Smoothed sunspot number |
|---|---|---|---|
| 2000.04 | 184.2 | 125.5 | 120.8 cycle 23 sunspot max. |
| 2000.07 | 202.3 | 170.1 | 119.8 |
| 2001.12 | 235.1 | 132.2 | 114.6 (-0.9) |
| 2004.10 | 105.9 | 48.0 | 35.9 (-1.6) |
| 2004.11 | 113.2 | 43.5 | 35.3 (-0.6) |
| 2004.12 | 94.5 | 17.9 | 35.2 (-0.1) |
| 2005.01 | 102.2 | 31.3 | 34.6 (-0.6) |
| 2005.02 | 97.2 | 29.2 | 33.9 (-0.7) |
| 2005.03 | 89.9 | 24.5 | 33.5 (-0.4) |
| 2005.04 | 86.0 | 24.4 | 31.6 (-1.9) |
| 2005.05 | 99.3 | 42.6 | 28.9 (-2.7) |
| 2005.06 | 93.7 | 39.6 | (28.1 predicted, -0.8) |
| 2005.07 | 96.4 | 39.9 | (27.6 predicted, -0.5) |
| 2005.08 | 90.5 | 36.4 | (25.7 predicted, -1.8) |
| 2005.09 | 91.1 | 22.1 | (23.6 predicted, -2.1) |
| 2005.10 | 77.0 | 8.5 | (21.6 predicted, -2.0) |
| 2005.11 | 86.3 | 18.0 | (19.2 predicted, -2.4) |
| 2005.12 | 100.3 (1) | 11.0 (2) | (16.4 predicted, -2.8) |
1) Running average based on the
daily 20:00 UTC observed solar flux
value at 2800 MHz.
2) Unofficial, accumulated value based on the Boulder (NOAA/SEC)
sunspot number. The official international sunspot number is typically
30-50% lower.
This report has been prepared by Jan Alvestad. It is based partly on my own observations and analysis, and partly on data from some of these solar data sources. All time references are to the UTC day. Comments and suggestions are always welcome.
| [DX-Listeners' Club] |