
Last major update issued on August 25,
2005 at 04:20 UTC.
[Solar and
geomagnetic data - last month (updated daily)]
[Solar wind and
electron fluence charts (updated daily)]
[Solar cycles 21-23
(last update August 2, 2005)]
[Solar cycles 1-20]
[Graphical comparison
of cycles 21, 22 and 23 (last update August 2, 2005)]
[Graphical
comparison of cycles 2, 10, 13, 17, 20 and 23 (last update August 2,
2005)]
[Historical solar and
geomagnetic data charts 1954-2004 (last update February 1, 2005)]
[Archived reports
(last update August 13, 2005)]
The geomagnetic field was unsettled to extremely severe storm on August 24. Solar wind speed ranged between 414 and 797 (all day average 619) km/sec. A solar wind shock was observed at SOHO at 05:33 UTC, its source was the full halo CME observed early on August 22. The interplanetary magnetic field was moderately to strongly southwards until 08h UTC. Just after 08:30 UTC solar wind speed increased abruptly again and the IMF became much stronger and swung extremely strongly southwards until 10h UTC, peaking at levels only observed during the most intense solar storms. This caused the planetary A index to reach its maximum possible value of 400. Several magnetometers recorded magnetic deviations up to 4 times the level required to reach the K index = 9 level. At about 20:30 UTC another sudden increase in solar wind speed was observed, this time likely related to the arrival of the second halo CME seen on August 22.
Solar flux measured at 20h UTC on 2.8 GHz was 98.6. The planetary
A
index was 110 (STAR Ap - based on the mean of three hour interval ap
indices: 109.9).
Three hour interval K indices: 33798565 (planetary), 33677544 (Boulder).
The background x-ray flux is at the class B2 level.
At midnight there were 4 spotted regions on the visible solar disk. The solar flare activity level was low. A total of 3 C class events was recorded during the day. Region S583 behind the southwest limb produced a C4.7 long duration event peaking at 07:06 UTC.
Region 10800 decayed quickly losing both penumbral area and many spots.
New region 10802 emerged in the southeast quadrant on August 23 and was numbered the next day by SEC.
New region 10803 rotated into view at the northeast limb. This region could produce minor M class flares. Flares:
C2.2 at 02:01 and C1.2 at 04:11 UTC.
Spotted regions not numbered by NOAA/SEC:
[S587] This region emerged in the northeast quadrant on August 24. Location at midnight: N12E25.
Another bipolar area with the magnetic field alignment expected for cycle 24 was observed emerging after 06h UTC on August 24. While this area brightened during the day before decaying late in the day, no spots were observed. The location at midnight was N38E02.
August 22: A complex CME event was observed after the M2.6 LDE
early in the day. While most of the CME was observed over
the southwest limb, contributions from disappearing filaments to the
east of flare source made this a full halo CME. It's actually
hard to tell if this CME should be separated into 2 or 3 different
CMEs, all occurring within a short time period. A large CME was
observed over the southwest limb following the major LDE event during
the afternoon. Extensions over the eastern hemisphere were
much weaker, however, it is still likely that Earth will receive some
effects even from this CME.
August 23: At least a partial halo CME was observed after the M2
LDE in region S583 during the afternoon.
August 24: No obvious partly or fully Earth directed CMEs were
observed.
Coronal hole
history (since late October 2002)
Compare today's report with the situation one solar rotation ago: 28
days ago 27 days ago 26
days ago
No obvious coronal hole are currently approaching an Earth facing position.
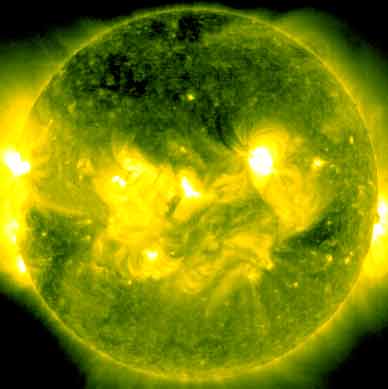
Processed SOHO/EIT 284 image at 01:06 UTC on August 25. The darkest areas on the solar disk are likely coronal holes.
The geomagnetic field is expected to be unsettled to minor storm on August 25 due to lingering CME effects. Quiet to active is likely on August 26 becoming quiet to unsettled on August 27.
| Coronal holes (1) | Coronal mass ejections (2) | M and X class flares (3) |
1) Effects from a coronal hole could reach Earth
within the next 5 days. When the high speed stream has arrived
the color changes to green.
2) Material from a CME is likely to impact Earth within 96 hours.
3) There is a possibility of either M or X class flares within the next
48 hours.
Green: 0-20% probability, Yellow: 20-60% probability, Red: 60-100% probability.
Long distance low and medium frequency (below 2 MHz) propagation along east-west paths over high and upper middle latitudes is poor. Propagation on long distance northeast-southwest paths is fair. Trans Atlantic propagation conditions are normally monitored every night on 1470 kHz. Dominant stations tonight: Before midnight UTC R�dio Rural AM de Parelhas had the most consistent signal of two Brazilians, later on Radio Cristal del Uruguay had the best signal. Surprisingly several stations from the northeastern parts of the USA were heard during the hour before LSR, both WWZN on 1510 and WWRU on 1660 had fair signals. Several stations from Argentina and Brazil were audible after LSR with the most interesting station Red 92 from Dolores (Buenos Aires) on 1480 kHz.

Compare to the previous day's image.
Data for all numbered solar regions according to the Solar Region Summary provided by NOAA/SEC. Comments are my own, as is the STAR spot count (spots observed at or inside a few hours before midnight) and data for regions not numbered by SEC or where SEC has observed no spots. SEC active region numbers in the table below and in the active region map above are the historic SEC/USAF numbers.
| Active region | Date numbered | SEC spot count |
STAR spot count |
Location at midnight | Area | Classification | Comment |
|---|---|---|---|---|---|---|---|
| 10798 | 2005.08.14 | 7 | S11W90 | 0430 | DKC | spotless SEC has included nearby region S583 in this region location: S09W81 |
|
| 10800 | 2005.08.19 | 28 | 18 | N17W21 | 0220 | EAI | classification was EAO at midnight |
| 10801 | 2005.08.20 | N08E07 | plage | ||||
| 10802 | 2005.08.24 | 1 | 1 | S12E14 | 0020 | HSX | formerly region S586 |
| 10803 | 2005.08.24 | 11 | 10 | N12E78 | 0030 | DAO | classification was DAI at midnight, area 0120 |
| S587 | 2005.08.24 | 3 | N12E25 | 0020 | DRO | ||
| Total spot count: | 47 | 32 | |||||
| SSN: | 87 | 72 | |||||
| Month | Average solar flux at Earth |
International sunspot number | Smoothed sunspot number |
|---|---|---|---|
| 2000.04 | 184.2 | 125.5 | 120.8 cycle 23 sunspot max. |
| 2000.07 | 202.3 | 170.1 | 119.8 |
| 2001.12 | 235.1 | 132.2 | 114.6 (-0.9) |
| 2004.06 | 97.4 | 43.2 | 41.6 (-2.2) |
| 2004.07 | 119.1 | 51.1 | 40.2 (-1.4) |
| 2004.08 | 109.6 | 40.9 | 39.2 (-1.0) |
| 2004.09 | 103.1 | 27.7 | 37.5 (-1.7) |
| 2004.10 | 105.9 | 48.0 | 35.9 (-1.6) |
| 2004.11 | 113.2 | 43.5 | 35.3 (-0.6) |
| 2004.12 | 94.5 | 17.9 | 35.2 (-0.1) |
| 2005.01 | 102.2 | 31.3 | 34.6 (-0.6) |
| 2005.02 | 97.2 | 29.2 | (33.5 predicted, -1.1) |
| 2005.03 | 89.9 | 24.5 | (32.1 predicted, -1.4) |
| 2005.04 | 86.0 | 24.4 | (30.2 predicted, -1.9) |
| 2005.05 | 99.3 | 42.6 | (27.6 predicted, -2.6) |
| 2005.06 | 93.7 | 39.6 | (26.1 predicted, -1.5) |
| 2005.07 | 96.4 | 39.9 | (25.1 predicted, -1.0) |
| 2005.08 | 90.8 (1) | 48.6 (2) | (23.2 predicted, -1.9) |
1) Running average based on the daily 20:00 UTC observed solar flux
value at 2800 MHz.
2) Unofficial, accumulated value based on the Boulder (NOAA/SEC)
sunspot number. The official international sunspot number is typically
30-50% lower.
This report has been prepared by Jan Alvestad. It is based partly on my own observations and analysis, and partly on data from some of these solar data sources. All time references are to the UTC day. Comments and suggestions are always welcome.
| [DX-Listeners' Club] |