
Last major update issued on August 19, 2005 at 04:55 UTC.
[Solar and
geomagnetic data - last month (updated daily)]
[Solar wind and
electron fluence charts (updated daily)]
[Solar cycles 21-23
(last update August 2, 2005)]
[Solar cycles 1-20]
[Graphical comparison
of cycles 21, 22 and 23 (last update August 2, 2005)]
[Graphical
comparison of cycles 2, 10, 13, 17, 20 and 23 (last update August 2, 2005)]
[Historical solar and
geomagnetic data charts 1954-2004 (last update February 1, 2005)]
[Archived reports
(last update August 13, 2005)]
The geomagnetic field was quiet to active on August 18. Solar wind speed ranged between 579 and 760 (all day average 658) km/sec, generally decreasing after 08h UTC.
Solar flux measured at 20h UTC on 2.8 GHz was 82.7. The planetary
A
index was 16 (STAR Ap - based on the mean of three hour interval ap
indices: 16.3).
Three hour interval K indices: 33443233 (planetary), 43442223 (Boulder).
The background x-ray flux is at the class A9 level.
At midnight there were 5 spotted regions on the visible solar disk. The solar flare activity level was very low. No C class events were recorded during the day.
Region 10797 was quiet and stable
Region 10798 developed slowly.
New region 10799 emerged in the southwest quadrant with a single spot.
Spotted regions not numbered by NOAA/SEC:
[S583] This is a quickly developing reversed polarity (maybe cycle 24?) region just west southwest of region 10798. The
first signs of the region were noted late on August 17. C flares are possible, maybe even a minor M class flare. The separation
between this and region 10798 can easily be seen in GOES SXI images. Location at midnight: S11W08
[S584] A new region emerged in the northeast quadrant on August 18. Location at midnight: N17E56.
August 16-18: No obvious partly or fully Earth directed CMEs were observed.
Coronal hole
history (since late October 2002)
Compare today's report with the situation one solar rotation ago: 28
days ago 27 days ago 26
days ago
A recurrent coronal hole (CH182) in the southern hemisphere was in an Earth facing position on August 17-18. While this coronal hole didn't produce any disturbance during the previous rotation, it has extended somewhat in a northerly direction. A recurrent coronal hole in the southern hemisphere will likely rotate to an Earth facing position on August 21-22.
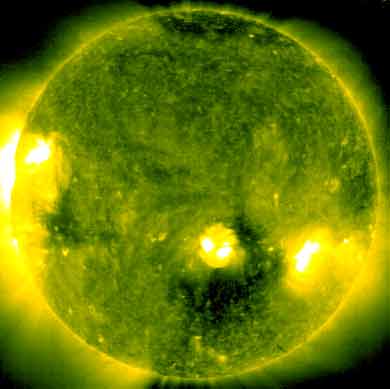
Processed SOHO/EIT 284 image at 01:06 UTC on August 19. The darkest areas on the solar disk are likely coronal holes.
The geomagnetic field is expected to be quiet to unsettled on August 19. Some effects from CH182 are possible starting late on August 20 and on August 21, possibly resulting in unsettled to active conditions.
| Coronal holes (1) | Coronal mass ejections (2) | M and X class flares (3) |
1) Effects from a coronal hole could reach Earth
within the next 5 days. When the high speed stream has arrived
the color changes to green.
2) Material from a CME is likely to impact Earth within 96 hours.
3) There is a possibility of either M or X class flares within the next
48 hours.
Green: 0-20% probability, Yellow: 20-60% probability, Red: 60-100% probability.
Long distance low and medium frequency (below 2 MHz) propagation along east-west paths over high and upper middle latitudes is poor to fair. Propagation on long distance northeast-southwest paths is poor. Trans Atlantic propagation conditions are normally monitored every night on 1470 kHz. Dominant stations tonight: Radio Vibraci�n (Venezuela). Before LSR a number of stations from the easternmost parts of the USA and Canada were heard throughout the MW band. Good signals were heard from the NY stations on 1050 and 1130 kHz and even WTIC on 1080 kHz had a fair signal. A couple of UNIDs were heard on 1230 kHz. South America was represented by some fair to strong signals from Venezuela and Colombia while fair to good signals could be heard from several Cuban and Puerto Rican stations.

Compare to the previous day's image.
Data for all numbered solar regions according to the Solar Region Summary provided by NOAA/SEC. Comments are my own, as is the STAR spot count (spots observed at or inside a few hours before midnight) and data for regions not numbered by SEC or where SEC has observed no spots. SEC active region numbers in the table below and in the active region map above are the historic SEC/USAF numbers.
| Active region | Date numbered | SEC spot count |
STAR spot count |
Location at midnight | Area | Classification | Comment |
|---|---|---|---|---|---|---|---|
| 10797 | 2005.08.11 | 1 | 2 | S14W38 | 0080 | HSX | classification was CSO at midnight |
| 10798 | 2005.08.14 | 9 | 6 | S10W05 | 0030 | DSO |
classification was CAO at midnight location: S08W04 |
| 10799 | 2005.08.18 | 2 | 1 | S12W56 | 0020 | CSO | classification was AXX at midnight |
| S583 | 2005.08.18 | 25 | S11W08 | 0120 | DAI | reversed polarity or cycle 24 region | |
| S584 | 2005.08.18 | 6 | N17E56 | 0030 | CAO | ||
| Total spot count: | 12 | 40 | |||||
| SSN: | 42 | 90 | |||||
| Month | Average solar flux at Earth |
International sunspot number | Smoothed sunspot number |
|---|---|---|---|
| 2000.04 | 184.2 | 125.5 | 120.8 cycle 23 sunspot max. |
| 2000.07 | 202.3 | 170.1 | 119.8 |
| 2001.12 | 235.1 | 132.2 | 114.6 (-0.9) |
| 2004.06 | 97.4 | 43.2 | 41.6 (-2.2) |
| 2004.07 | 119.1 | 51.1 | 40.2 (-1.4) |
| 2004.08 | 109.6 | 40.9 | 39.2 (-1.0) |
| 2004.09 | 103.1 | 27.7 | 37.5 (-1.7) |
| 2004.10 | 105.9 | 48.0 | 35.9 (-1.6) |
| 2004.11 | 113.2 | 43.5 | 35.3 (-0.6) |
| 2004.12 | 94.5 | 17.9 | 35.2 (-0.1) |
| 2005.01 | 102.2 | 31.3 | 34.6 (-0.6) |
| 2005.02 | 97.2 | 29.2 | (33.5 predicted, -1.1) |
| 2005.03 | 89.9 | 24.5 | (32.1 predicted, -1.4) |
| 2005.04 | 86.0 | 24.4 | (30.2 predicted, -1.9) |
| 2005.05 | 99.3 | 42.6 | (27.6 predicted, -2.6) |
| 2005.06 | 93.7 | 39.6 | (26.1 predicted, -1.5) |
| 2005.07 | 96.4 | 39.9 | (25.1 predicted, -1.0) |
| 2005.08 | 87.8 (1) | 34.4 (2) | (23.2 predicted, -1.9) |
1) Running average based on the daily 20:00 UTC observed solar flux
value at 2800 MHz.
2) Unofficial, accumulated value based on the Boulder (NOAA/SEC)
sunspot number. The official international sunspot number is typically
30-50% lower.
This report has been prepared by Jan Alvestad. It is based partly on my own observations and analysis, and partly on data from some of these solar data sources. All time references are to the UTC day. Comments and suggestions are always welcome.
| [DX-Listeners' Club] |