
Last major update issued on August 18, 2005 at 05:05 UTC.
[Solar and
geomagnetic data - last month (updated daily)]
[Solar wind and
electron fluence charts (updated daily)]
[Solar cycles 21-23
(last update August 2, 2005)]
[Solar cycles 1-20]
[Graphical comparison
of cycles 21, 22 and 23 (last update August 2, 2005)]
[Graphical
comparison of cycles 2, 10, 13, 17, 20 and 23 (last update August 2, 2005)]
[Historical solar and
geomagnetic data charts 1954-2004 (last update February 1, 2005)]
[Archived reports
(last update August 13, 2005)]
The geomagnetic field was quiet to active on August 17. Solar wind speed ranged between 592 and 771 (all day average 701) km/sec under the influence of a high speed stream from CH181.
Solar flux measured at 20h UTC on 2.8 GHz was 77.0. The planetary
A
index was 18 (STAR Ap - based on the mean of three hour interval ap
indices: 17.5).
Three hour interval K indices: 44323334 (planetary), 43333324 (Boulder).
The background x-ray flux is at the class A5 level.
At midnight there were 2 spotted regions on the visible solar disk. The solar flare activity level was very low. No C class events were recorded during the day.
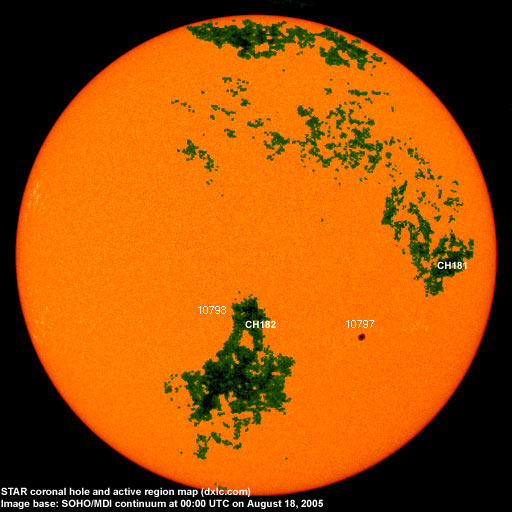
Region 10797 decayed further and only has a few penumbraless trailing spots outside of the leader spot.
Region 10798 decayed slowly and quietly. A new spot emerged immediately to the west southwest of this region and may
have to be split off into a separate region. Magnetograms has this new area with reversed polarities.
August 15-17: No obvious partly or fully Earth directed CMEs were observed.
Coronal hole
history (since late October 2002)
Compare today's report with the situation one solar rotation ago: 28
days ago 27 days ago 26
days ago
Recurrent trans equatorial coronal hole (CH181) was in an Earth facing position on August 13-15. A recurrent coronal hole (CH182) in the southern hemisphere was in an Earth facing position on August 17-18. While this coronal hole didn't produce any disturbance during the previous rotation, it has extended somewhat in a northerly direction.

Processed SOHO/EIT 284 image at 19:06 UTC on August 17. The darkest areas on the solar disk are likely coronal holes.
The geomagnetic field is expected to be quiet to unsettled on August 18-19. Some effects from CH182 are possible starting late on August 20 and on August 21, possibly resulting in unsettled to active conditions.
| Coronal holes (1) | Coronal mass ejections (2) | M and X class flares (3) |
1) Effects from a coronal hole could reach Earth
within the next 5 days. When the high speed stream has arrived
the color changes to green.
2) Material from a CME is likely to impact Earth within 96 hours.
3) There is a possibility of either M or X class flares within the next
48 hours.
Green: 0-20% probability, Yellow: 20-60% probability, Red: 60-100% probability.
Long distance low and medium frequency (below 2 MHz) propagation along east-west paths over high and upper middle latitudes is poor to fair. Propagation on long distance northeast-southwest paths is fair. Trans Atlantic propagation conditions are normally monitored every night on 1470 kHz. Dominant stations tonight: Radio Cristal del Uruguay and Radio Vibraci�n (Venezuela). After LSR there were many signals from Argentina and southern Brazil. 710 Radio Diez and 1120 R�dio Rural were both in with good signals. Before LSR and on the EWE pointed NNW there were a number of stations from North America (800 VOWR and 920 CJCH had the best signals, however, most of the 50 kW stations from the Boston and New York areas were audible as well), the Caribbean (mostly Cuba with 890 having a strong signal) and northern South America (several stations from Colombia including 970 Radio Super and 980 RCN Cal�). Overall propagation was much better than expected.
Compare to the previous day's image.
Data for all numbered solar regions according to the Solar Region Summary provided by NOAA/SEC. Comments are my own, as is the STAR spot count (spots observed at or inside a few hours before midnight) and data for regions not numbered by SEC or where SEC has observed no spots. SEC active region numbers in the table below and in the active region map above are the historic SEC/USAF numbers.
| Active region | Date numbered | SEC spot count |
STAR spot count |
Location at midnight | Area | Classification | Comment |
|---|---|---|---|---|---|---|---|
| 10797 | 2005.08.11 | 20 | 6 | S14W23 | 0090 | DSO | classification was CSO at midnight |
| 10798 | 2005.08.14 | 2 | 3 | S09E12 | 0020 | CSO | classification was BXO at midnight, area 0010. The westernmost spot could be a separate region |
| S581 | 2005.08.12 | S10W27 | plage | ||||
| Total spot count: | 22 | 9 | |||||
| SSN: | 42 | 29 | |||||
| Month | Average solar flux at Earth |
International sunspot number | Smoothed sunspot number |
|---|---|---|---|
| 2000.04 | 184.2 | 125.5 | 120.8 cycle 23 sunspot max. |
| 2000.07 | 202.3 | 170.1 | 119.8 |
| 2001.12 | 235.1 | 132.2 | 114.6 (-0.9) |
| 2004.06 | 97.4 | 43.2 | 41.6 (-2.2) |
| 2004.07 | 119.1 | 51.1 | 40.2 (-1.4) |
| 2004.08 | 109.6 | 40.9 | 39.2 (-1.0) |
| 2004.09 | 103.1 | 27.7 | 37.5 (-1.7) |
| 2004.10 | 105.9 | 48.0 | 35.9 (-1.6) |
| 2004.11 | 113.2 | 43.5 | 35.3 (-0.6) |
| 2004.12 | 94.5 | 17.9 | 35.2 (-0.1) |
| 2005.01 | 102.2 | 31.3 | 34.6 (-0.6) |
| 2005.02 | 97.2 | 29.2 | (33.5 predicted, -1.1) |
| 2005.03 | 89.9 | 24.5 | (32.1 predicted, -1.4) |
| 2005.04 | 86.0 | 24.4 | (30.2 predicted, -1.9) |
| 2005.05 | 99.3 | 42.6 | (27.6 predicted, -2.6) |
| 2005.06 | 93.7 | 39.6 | (26.1 predicted, -1.5) |
| 2005.07 | 96.4 | 39.9 | (25.1 predicted, -1.0) |
| 2005.08 | 88.1 (1) | 33.1 (2) | (23.2 predicted, -1.9) |
1) Running average based on the daily 20:00 UTC observed solar flux
value at 2800 MHz.
2) Unofficial, accumulated value based on the Boulder (NOAA/SEC)
sunspot number. The official international sunspot number is typically
30-50% lower.
This report has been prepared by Jan Alvestad. It is based partly on my own observations and analysis, and partly on data from some of these solar data sources. All time references are to the UTC day. Comments and suggestions are always welcome.
| [DX-Listeners' Club] |