
Last major update issued on August 9, 2005 at 04:35 UTC.
[Solar and
geomagnetic data - last month (updated daily)]
[Solar wind and
electron fluence charts (updated daily)]
[Solar cycles 21-23
(last update August 2, 2005)]
[Solar cycles 1-20]
[Graphical comparison
of cycles 21, 22 and 23 (last update August 2, 2005)]
[Graphical
comparison of cycles 2, 10, 13, 17, 20 and 23 (last update August 2, 2005)]
[Historical solar and
geomagnetic data charts 1954-2004 (last update February 1, 2005)]
[Archived reports
(last update August 3, 2005)]
The geomagnetic field was quiet to unsettled on August 8. Solar wind speed ranged between 453 and 605 (all day average 500) km/sec.
Solar flux measured at 20h UTC on 2.8 GHz was 86.4. The planetary
A
index was 8 (STAR Ap - based on the mean of three hour interval ap
indices: 8.5).
Three hour interval K indices: 22312213 (planetary), 33313223 (Boulder).
The background x-ray flux is at the class A8 level.
At midnight there were 4 spotted regions on the visible solar disk. The solar flare activity level was very low. No C class events were recorded during the day.
Region 10792 added a small penumbra to the northeast of the trailing positive polarity penumbrae. This region has
reversed polarities.
Region 10794 decayed slowly and quietly.
Region 10795 decayed further and lost nearly half of its penumbral coverage.
Region 10796 developed slowly. A small positive polarity area is at the southwestern edge of the southern negative
polarity penumbra.
August 6-8: No obvious partly or fully Earth directed CMEs were observed.
Coronal hole
history (since late October 2002)
Compare today's report with the situation one solar rotation ago: 28
days ago 27 days ago 26
days ago
A trans equatorial coronal (CH180) will rotate to an Earth facing position on August 8-9.
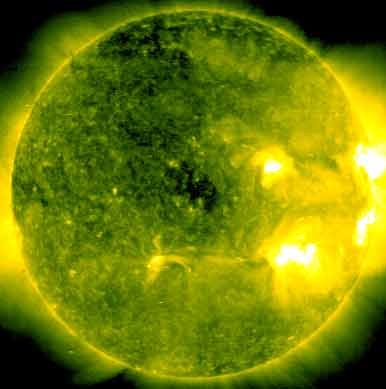
Processed SOHO/EIT 284 image at 01:06 UTC on August 9. The darkest areas on the solar disk are likely coronal holes.
The geomagnetic field is expected to be quiet to unsettled on August 9-10 becoming quiet to active on August 11 due to effects from CH180.
| Coronal holes (1) | Coronal mass ejections (2) | M and X class flares (3) |
1) Effects from a coronal hole could reach Earth
within the next 5 days. When the high speed stream has arrived
the color changes to green.
2) Material from a CME is likely to impact Earth within 96 hours.
3) There is a possibility of either M or X class flares within the next
48 hours.
Green: 0-20% probability, Yellow: 20-60% probability, Red: 60-100% probability.
Long distance low and medium frequency (below 2 MHz) propagation along east-west paths over high and upper middle latitudes is poor. Propagation on long distance northeast-southwest paths is fair to good. Trans Atlantic propagation conditions are normally monitored every night on 1470 kHz. Dominant stations tonight: Radio Cristal del Uruguay and CPN Radio (Per�). Like the other Peruvian station Radio Santa Rosa on 1499.93 kHz was heard best 60 to 15 minutes before LSR. Radio Agricultura was noted on 1590 kHz with interesting signals on several other frequencies. After LSR propagation favored Argentina (710, 790, 870, 1070, 1110 and 1190 kHz had the best signals), Uruguay and the southeastern and northeastern parts of Brazil (580, 740, 970 and 1350 kHz were best). Before 02h UTC propagation was best towards the easternmost parts of North America and the Caribbean. Florida stations were noted on 1660 (WCNZ on top of WGIT), 1680 and 1700 kHz.

Compare to the previous day's image.
Data for all numbered solar regions according to the Solar Region Summary provided by NOAA/SEC. Comments are my own, as is the STAR spot count (spots observed at or inside a few hours before midnight) and data for regions not numbered by SEC or where SEC has observed no spots. SEC active region numbers in the table below and in the active region map above are the historic SEC/USAF numbers.
| Active region | Date numbered | SEC spot count |
STAR spot count |
Location at midnight | Area | Classification | Comment |
|---|---|---|---|---|---|---|---|
| 10792 | 2005.07.28 | 5 | 8 | N11W68 | 0120 | DSO | classification was DAO at midnight |
| 10794 | 2005.07.31 | 5 | 3 | S13W36 | 0120 | CSO | classification was CAO, area 0160 at midnight |
| 10795 | 2005.07.31 | 1 | 1 | N12W27 | 0050 | HSX | classification was HAX at midnight, area 0040 |
| 10796 | 2005.08.03 | 5 | 5 | S08W64 | 0080 | DSO | classification was DAO at midnight |
| Total spot count: | 16 | 17 | |||||
| SSN: | 56 | 57 | |||||
| Month | Average solar flux at Earth |
International sunspot number | Smoothed sunspot number |
|---|---|---|---|
| 2000.04 | 184.2 | 125.5 | 120.8 cycle 23 sunspot max. |
| 2000.07 | 202.3 | 170.1 | 119.8 |
| 2001.12 | 235.1 | 132.2 | 114.6 (-0.9) |
| 2004.06 | 97.4 | 43.2 | 41.6 (-2.2) |
| 2004.07 | 119.1 | 51.1 | 40.2 (-1.4) |
| 2004.08 | 109.6 | 40.9 | 39.2 (-1.0) |
| 2004.09 | 103.1 | 27.7 | 37.5 (-1.7) |
| 2004.10 | 105.9 | 48.0 | 35.9 (-1.6) |
| 2004.11 | 113.2 | 43.5 | 35.3 (-0.6) |
| 2004.12 | 94.5 | 17.9 | 35.2 (-0.1) |
| 2005.01 | 102.2 | 31.3 | 34.6 (-0.6) |
| 2005.02 | 97.2 | 29.1 | (33.5 predicted, -1.1) |
| 2005.03 | 89.9 | 24.8 | (32.1 predicted, -1.4) |
| 2005.04 | 86.0 | 24.4 | (30.2 predicted, -1.9) |
| 2005.05 | 99.3 | 42.6 | (27.6 predicted, -2.6) |
| 2005.06 | 93.7 | 39.3 | (26.1 predicted, -1.5) |
| 2005.07 | 96.4 | 39.9 | (25.1 predicted, -1.0) |
| 2005.08 | 100.9 (1) | 21.0 (2) | (23.2 predicted, -1.9) |
1) Running average based on the daily 20:00 UTC observed solar flux
value at 2800 MHz.
2) Unofficial, accumulated value based on the Boulder (NOAA/SEC)
sunspot number. The official international sunspot number is typically
30-50% lower.
This report has been prepared by Jan Alvestad. It is based partly on my own observations and analysis, and partly on data from some of these solar data sources. All time references are to the UTC day. Comments and suggestions are always welcome.
| [DX-Listeners' Club] |