
Last major update issued on November 1, 2004 at 03:55 UTC.
[Solar and geomagnetic data - last month (updated daily)]
[Solar wind and electron fluence charts (updated daily)]
[Solar cycles 21-23 (last update October 2, 2004)]
[Solar cycles 1-20]
[Graphical comparison of cycles 21, 22 and 23 (last update October 2, 2004)]
[Graphical comparison of cycles 2, 10, 13, 17, 20 and 23 (last update October 2, 2004)]
[Historical solar and geomagnetic data charts 1954-2004 (last update August 28,
2004)]
[Archived reports (last update October 30, 2004)]
The geomagnetic field was quiet to unsettled on October 31. Solar wind speed ranged between 400 and 468 km/sec under the influence of a fairly low speed stream from coronal hole CH121.
Solar flux measured at 17h UTC on 2.8 GHz was 139.2. The planetary A
index was 10 (STAR Ap - based on the mean of three hour interval ap indices: 9.5).
Three hour interval K indices: 32123223 (planetary), 33122323 (Boulder).
The background x-ray flux is at the class B4 level.
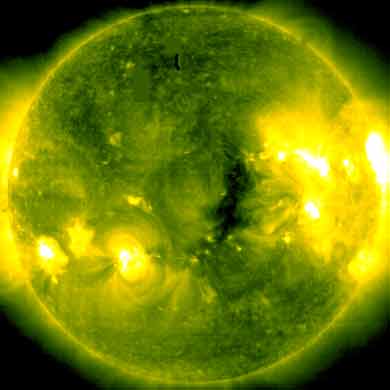
At midnight there were 6 spotted regions on the visible solar disk. The solar flare activity level was moderate. A total of 5 C and 2 M class events was recorded during the day.
Region 10687 decayed further and lost the remaining penumbra. Only a single small spot is visible and the region will rotate out of view at the northeast limb today.
October 30: It is likely that several CMEs were associated with M and X class flares in region region 10691 this day. Most
of these could reach Earth on November 1 and 2. Unfortunately LASCO images were not available for the parts of the day
when flaring in region 10691 was most intense. With images back in the afternoon only a single full halo CME was observed, this
was after the major M5.9 event.
October 29 and 31: No obviously Earth directed CMEs observed.
Coronal hole history (since late October 2002)
Compare today's report with the situation one solar rotation ago: 28
days ago 27 days ago
26 days ago
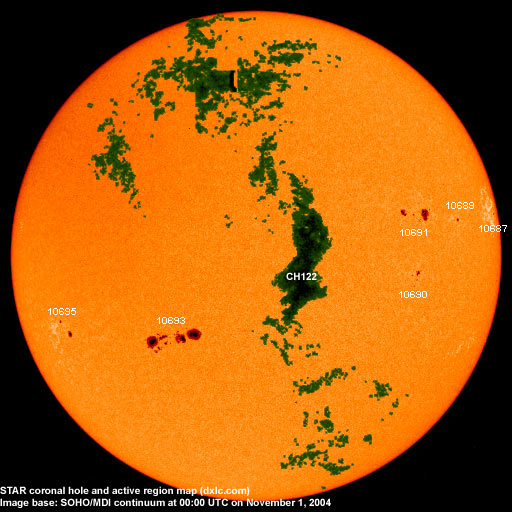
A trans equatorial coronal hole (CH122) was in a geoeffective position on October 30-31.
Processed SOHO/EIT 284 image at 01:06 UTC on November 1. The darkest areas on the solar disk are likely coronal holes.
The geomagnetic field is expected to be quiet to major storm on November 1 and unsettled to minor storm on November 2. Unsettled to active is likely on November 3-4 due to effects from coronal hole CH122.
| Coronal holes (1) | Coronal mass ejections (2) | M and X class flares (3) |
1) Effects from a coronal hole could reach Earth within the next 5 days. When the high speed stream has arrived
the color changes to green.
2) Material from a CME is likely to impact Earth within 96 hours.
3) There is a possibility of either M or X class flares within the next 48 hours.
Green: 0-20% probability, Yellow: 20-60% probability, Red: 60-100% probability.
Long distance low and medium frequency (below 2 MHz) propagation along east-west paths over high and upper middle latitudes is poor. Propagation along long distance north-south paths is poor to fair. Trans Atlantic propagation conditions are normally monitored every night on 1470 kHz. Dominant stations tonight: Radio Vibraci�n (Venezuela) and Radio Cristal del Uruguay. On other frequencies propagation was best towards the Canadian Atlantic provinces, Boston, Flroida, Cuba, Puerto Rico and Venezuela. Post sunrise propagation on October 31 was interesting with some east coast North American stations audible until 09h UTC, well over 2 hours after local sunrise.
Compare to the previous day's image.
Data for all numbered solar regions according to the Solar Region Summary provided by NOAA/SEC. Comments are my own, as is the STAR spot count (spots observed at or inside a few hours before midnight) and data for regions not numbered by SEC or where SEC has observed no spots. SEC active region numbers in the table below and in the active region map above are the historic SEC/USAF numbers.
| Active region | Date numbered | SEC spot count |
STAR spot count |
Location at midnight | Area | Classification | Comment |
|---|---|---|---|---|---|---|---|
| 10687 | 2004.10.19 | 4 | 1 | N12W80 | 0060 | CAO |
classification was HRX at midnight, area 0010 |
| 10689 | 2004.10.21 | 1 | 1 | N11W57 | 0040 | HSX |
area was 0020 at midnight |
| 10690 | 2004.10.22 | 7 | 7 | S02W41 | 0040 | DAO |
classification was CAO at midnight |
| 10691 | 2004.10.23 | 23 | 14 | N13W42 | 0270 | DAC |
beta-gamma-delta classification was DAO at midnight |
| 10692 | 2004.10.24 | S19W67 | plage | ||||
| 10693 | 2004.10.27 | 50 | 39 | S16E22 | 0760 | FKC | beta-gamma |
| 10694 | 2004.10.28 | 4 | N14W16 | 0010 | AXX | spotless | |
| 10695 | 2004.10.30 | 4 | 4 | S15E55 | 0130 | DAO |
area was 0070 at midnight |
| S467 | emerged on 2004.10.26 |
S08W78 | plage | ||||
| Total spot count: | 93 | 66 | |||||
| SSN: | 163 | 126 | |||||
| Month | Average solar flux at Earth |
International sunspot number | Smoothed sunspot number |
|---|---|---|---|
| 2000.04 | 184.2 | 125.5 | 120.8 cycle 23 sunspot max. |
| 2000.07 | 202.3 | 170.1 | 119.8 |
| 2001.12 | 235.1 | 132.2 | 114.6 (-0.9) |
| 2003.08 | 122.1 | 72.7 | 60.0 (-1.7) |
| 2003.09 | 112.2 | 48.7 | 59.5 (-0.5) |
| 2003.10 | 151.7 | 65.5 | 58.2 (-1.3) |
| 2003.11 | 140.8 | 67.3 | 56.7 (-1.5) |
| 2003.12 | 114.9 | 46.5 | 54.8 (-1.9) |
| 2004.01 | 114.1 | 37.3 | 52.0 (-2.8) |
| 2004.02 | 107.0 | 45.8 | 49.3 (-2.7) |
| 2004.03 | 112.0 | 49.1 | 47.1 (-2.2) |
| 2004.04 | 101.2 | 39.3 | (44.6 predicted, -2.5) |
| 2004.05 | 99.8 | 41.5 | (40.9 predicted, -3.7) |
| 2004.06 | 97.4 | 43.2 | (38.0 predicted, -2.9) |
| 2004.07 | 119.1 | 51.0 | (36.2 predicted, -1.8) |
| 2004.08 | 109.6 | 40.9 | (34.6 predicted, -1.6) |
| 2004.09 | 103.1 | 27.7 | (32.8 predicted, -1.6) |
| 2004.10 | 105.9 (1) | 77.9 (2) | (30.5 predicted, -2.3) |
1) Running average based on the daily 20:00 UTC observed solar flux value at 2800 MHz.
2) Unofficial, accumulated value based on the Boulder (NOAA/SEC) sunspot number. The official international sunspot number is typically
30-50% less.
This report has been prepared by Jan Alvestad. It is based partly on my own observations and analysis, and partly on data from some of these solar data sources. All time references are to the UTC day. Comments and suggestions are always welcome.
| [DX-Listeners' Club] |