
Last major update issued on October 18, 2004 at 02:35 UTC.
[Solar and geomagnetic data - last month (updated daily)]
[Solar wind and electron fluence charts (updated daily)]
[Solar cycles 21-23 (last update October 2, 2004)]
[Solar cycles 1-20]
[Graphical comparison of cycles 21, 22 and 23 (last update October 2, 2004)]
[Graphical comparison of cycles 2, 10, 13, 17, 20 and 23 (last update October 2, 2004)]
[Historical solar and geomagnetic data charts 1954-2004 (last update August 28,
2004)]
[Archived reports (last update October 10, 2004)]
The geomagnetic field was quiet on October 17. Solar wind speed ranged between 290 and 312 km/sec. Since about 22h UTC on October 17 both solar wind speed and density have been increasing slowly, an indication of an approaching coronal hole flow.
Solar flux measured at 20h UTC on 2.8 GHz was 91.9. The planetary A
index was 3 (STAR Ap - based on the mean of three hour interval ap indices: 3.3).
Three hour interval K indices: 01111011 (planetary), 01111211 (Boulder).
The background x-ray flux is at the class A9 level.
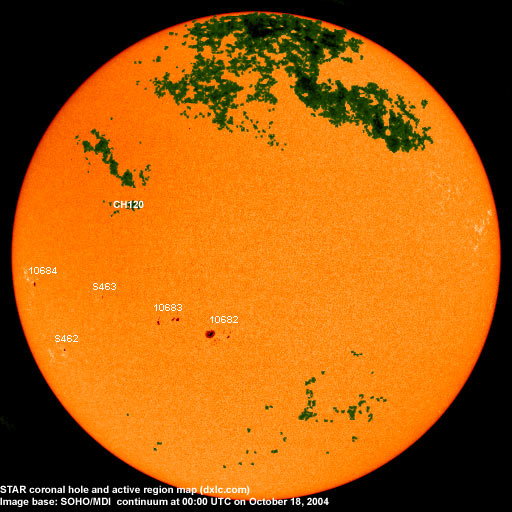
At midnight there were 5 spotted regions on the visible solar disk. The solar flare activity level was very low. No C class events were recorded during the day.
Region 10682 decayed significantly with penumbra disappearing from the spots in the south.
New region 10683 emerged in the southeast quadrant on October 16 and was numbered by SEC the next day. The region developed
on October 17, however, the magnetic field layout looks less disorganized today. Further growth, if any, is likely to be slow.
New region 10684 rotated into view at the southeast limb on October 16 and was numbered the next day by SEC. The single
penumbra increased slowly in area.
Spotted regions not numbered by NOAA/SEC:
[S462] This region emerged near the southeast limb on October 16. Slow development was observed on October 17. Location at midnight:
S19E55.
[S463] A new region emerged in the southeast quadrant on October 17. Location at midnight: S05E38.
October 16-18: No obviously Earth directed CMEs observed.
Coronal hole history (since late October 2002)
Compare today's report with the situation one solar rotation ago: 28
days ago 27 days ago
26 days ago
A poorly defined coronal hole (CH119) in the southern hemisphere may have been in a geoeffective position on October 14-15.

Processed SOHO/EIT 284 image at 19:06 UTC on October 17. The darkest areas on the solar disk are likely coronal holes.
The geomagnetic field is expected to be quiet to unsettled on October 18-19 due to a weak coronal hole flow. Quiet is likely on October 20-23 and most of October 24. Beginning sometime on October 24 and until October 26 a recurrent high speed stream from coronal hole CH120 will likely cause unsettled to active conditions.
| Coronal holes (1) | Coronal mass ejections (2) | M and X class flares (3) |
1) Effects from a coronal hole could reach Earth within the next 5 days. When the high speed stream has arrived
the color changes to green.
2) Material from a CME is likely to impact Earth within 96 hours.
3) There is a possibility of either M or X class flares within the next 48 hours.
Green: 0-20% probability, Yellow: 20-60% probability, Red: 60-100% probability.
Long distance low and medium frequency (below 2 MHz) propagation along east-west paths over high and upper middle latitudes is fair to poor. Propagation along long distance north-south paths is fair to poor. Trans Atlantic propagation conditions are monitored every night on 1470 kHz. Dominant stations tonight: Radio Vibraci�n (Venezuela) and Radio Cristal del Uruguay with fair signals. WWNN Pompano Beach was noted occasionally. On other frequencies propagation was best towards Newfoundland, Puerto Rico, the Bahamas (good signal on 1540 kHz) and Venezuela. Greenland on 650 kHz was occasionally strong.
Propagation after local sunrise on October 17 was fairly unusual with no stations from North America and the Caribbean and only a few weak signals from Venezuela. Brazilian stations had the best signals with stations surprisingly popping up on frequencies where I've never heard Brazilians, 660 and 870 kHz were the most interesting frequencies.
Compare to the previous day's image.
Data for all numbered solar regions according to the Solar Region Summary provided by NOAA/SEC. Comments are my own, as is the STAR spot count (spots observed at or inside a few hours before midnight) and data for regions not numbered by SEC or where SEC has observed no spots. SEC active region numbers in the table below and in the active region map above are the historic SEC/USAF numbers.
| Active region | Date numbered | SEC spot count |
STAR spot count |
Location at midnight | Area | Classification | Comment |
|---|---|---|---|---|---|---|---|
| 10681 | 2004.10.12 | N10W75 | plage | ||||
| 10682 | 2004.10.13 | 14 | 13 | S14E10 | 0150 | DAO | |
| 10683 | 2004.10.17 | 6 | 9 | S09E22 | 0030 | CAO |
formerly region S460 classification was DAO at midnight, area 0070 |
| 10684 | 2004.10.17 | 1 | 1 | S04E65 | 0030 | HSX |
formerly region S461 classification was HAX at midnight, area 0040 |
| S462 | emerged on 2004.10.16 |
1 | S19E55 | 0020 | HSX | ||
| S463 | emerged on 2004.10.17 |
1 | S05E38 | 0010 | HRX | ||
| Total spot count: | 21 | 25 | |||||
| SSN: | 51 | 75 | |||||
| Month | Average solar flux at Earth |
International sunspot number | Smoothed sunspot number |
|---|---|---|---|
| 2000.04 | 184.2 | 125.5 | 120.8 cycle 23 sunspot max. |
| 2000.07 | 202.3 | 170.1 | 119.8 |
| 2001.12 | 235.1 | 132.2 | 114.6 (-0.9) |
| 2003.08 | 122.1 | 72.7 | 60.0 (-1.7) |
| 2003.09 | 112.2 | 48.7 | 59.5 (-0.5) |
| 2003.10 | 151.7 | 65.5 | 58.2 (-1.3) |
| 2003.11 | 140.8 | 67.3 | 56.7 (-1.5) |
| 2003.12 | 114.9 | 46.5 | 54.8 (-1.9) |
| 2004.01 | 114.1 | 37.3 | 52.0 (-2.8) |
| 2004.02 | 107.0 | 45.8 | 49.3 (-2.7) |
| 2004.03 | 112.0 | 49.1 | 47.1 (-2.2) |
| 2004.04 | 101.2 | 39.3 | (44.6 predicted, -2.5) |
| 2004.05 | 99.8 | 41.5 | (40.9 predicted, -3.7) |
| 2004.06 | 97.4 | 43.2 | (38.0 predicted, -2.9) |
| 2004.07 | 119.1 | 51.0 | (36.2 predicted, -1.8) |
| 2004.08 | 109.6 | 40.9 | (34.6 predicted, -1.6) |
| 2004.09 | 103.1 | 27.7 | (32.8 predicted, -1.6) |
| 2004.10 | 89.8 (1) | 17.2 (2) | (30.5 predicted, -2.3) |
1) Running average based on the daily 20:00 UTC observed solar flux value at 2800 MHz.
2) Unofficial, accumulated value based on the Boulder (NOAA/SEC) sunspot number. The official international sunspot number is typically
30-50% less.
This report has been prepared by Jan Alvestad. It is based partly on my own observations and analysis, and partly on data from some of these solar data sources. All time references are to the UTC day. Comments and suggestions are always welcome.
| [DX-Listeners' Club] |