
Last major update issued on October 17, 2004 at 02:50 UTC.
[Solar and geomagnetic data - last month (updated daily)]
[Solar wind and electron fluence charts (updated daily)]
[Solar cycles 21-23 (last update October 2, 2004)]
[Solar cycles 1-20]
[Graphical comparison of cycles 21, 22 and 23 (last update October 2, 2004)]
[Graphical comparison of cycles 2, 10, 13, 17, 20 and 23 (last update October 2, 2004)]
[Historical solar and geomagnetic data charts 1954-2004 (last update August 28,
2004)]
[Archived reports (last update October 10, 2004)]
The geomagnetic field was quiet to unsettled on October 16. Solar wind speed ranged between 297 and 457 km/sec, gradually decreasing throughout the day.
Solar flux measured at 20h UTC on 2.8 GHz was 91.7. The planetary A
index was 5 (STAR Ap - based on the mean of three hour interval ap indices: 4.8).
Three hour interval K indices: 31111111 (planetary), 31111101 (Boulder).
The background x-ray flux is at the class A7 level.
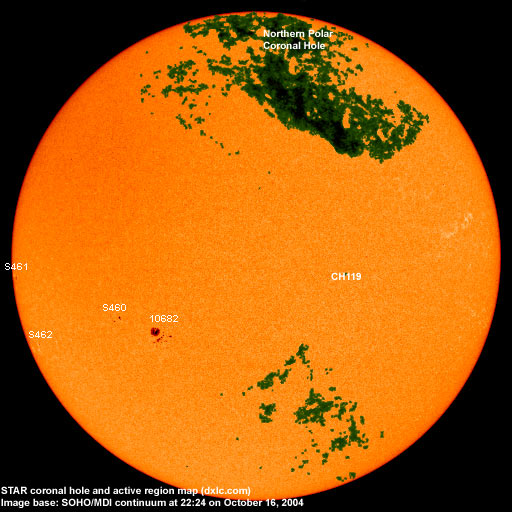
At midnight there were 4 spotted regions on the visible solar disk. The solar flare activity level was very low. No C class events were recorded during the day.
Region 10682 developed further and has become more complex again with a weak magnetic delta forming in the southern part of the region. The negative polarity areas in the north are still expanding and the inversion line is still mostly east-west. The chance of a minor M class flare is increasing.
Spotted regions not numbered by NOAA/SEC:
[S460] This region emerged quickly in the southeast quadrant after noon on October 16. Location at midnight: S09E34
[S461] A new region rotated into view at the southeast limb on October 16. Location at midnight: S04E77.
[S462] This region emerged near the southeast limb on October 16. Location at midnight: S19E68.
October 15-17: No obviously Earth directed CMEs observed.
Coronal hole history (since late October 2002)
Compare today's report with the situation one solar rotation ago: 28
days ago 27 days ago
26 days ago
A poorly defined coronal hole (CH119) in the southern hemisphere may have been in a geoeffective position on October 14-15.

Processed SOHO/EIT 284 image at 19:06 UTC on October 16. The darkest areas on the solar disk are likely coronal holes.
The geomagnetic field is expected to be quiet on October 17. On October 18 a weak recurrent coronal hole flow could cause a minor increase in geomagnetic activity with quiet to unsettled likely that day and on October 19.
| Coronal holes (1) | Coronal mass ejections (2) | M and X class flares (3) |
1) Effects from a coronal hole could reach Earth within the next 5 days. When the high speed stream has arrived
the color changes to green.
2) Material from a CME is likely to impact Earth within 96 hours.
3) There is a possibility of either M or X class flares within the next 48 hours.
Green: 0-20% probability, Yellow: 20-60% probability, Red: 60-100% probability.
Long distance low and medium frequency (below 2 MHz) propagation along east-west paths over high and upper middle latitudes is very poor. Propagation along long distance north-south paths is fair to poor. Trans Atlantic propagation conditions are monitored every night on 1470 kHz. Dominant stations tonight: Radio Vibraci�n (Venezuela) and Radio Cristal del Uruguay with weak signals. On other frequencies propagation was best towards Puerto Rico with stations heard on 580, 1280, 1480, 1520 and 1660 kHz. A few other stations from the Caribbean managed to cross the Atlantic as well. From North America CJYQ on 930 kHz had a weak signal when I first checked at midnight UTC, however, even their signal disappeared leaving no North American stations to be heard for the next few hours. This development was surprising considering the drop in geomagnetic activity. On the positive side a few signals from the Far East were observed yesterday evening before local sunset (738, 1557, 1566 and 1575 kHz).
Propagation at and just after local sunrise on October 16 was fairly good towards Venezuela, particularly below 1000 kHz.
Compare to the previous day's image.
Data for all numbered solar regions according to the Solar Region Summary provided by NOAA/SEC. Comments are my own, as is the STAR spot count (spots observed at or inside a few hours before midnight) and data for regions not numbered by SEC or where SEC has observed no spots. SEC active region numbers in the table below and in the active region map above are the historic SEC/USAF numbers.
| Active region | Date numbered | SEC spot count |
STAR spot count |
Location at midnight | Area | Classification | Comment |
|---|---|---|---|---|---|---|---|
| 10681 | 2004.10.12 | 2 | N10W62 | 0010 | AXX | spotless | |
| 10682 | 2004.10.13 | 21 | 23 | S14E24 | 0210 | DAI | beta-gamma-delta |
| S460 | emerged on 2004.10.16 |
6 | S09E34 | 0030 | DAO | ||
| S461 | visible on 2004.10.16 |
1 | S04E77 | 0030 | HAX | ||
| S462 | emerged on 2004.10.16 |
1 | S19E68 | 0010 | AXX | ||
| Total spot count: | 23 | 31 | |||||
| SSN: | 43 | 71 | |||||
| Month | Average solar flux at Earth |
International sunspot number | Smoothed sunspot number |
|---|---|---|---|
| 2000.04 | 184.2 | 125.5 | 120.8 cycle 23 sunspot max. |
| 2000.07 | 202.3 | 170.1 | 119.8 |
| 2001.12 | 235.1 | 132.2 | 114.6 (-0.9) |
| 2003.08 | 122.1 | 72.7 | 60.0 (-1.7) |
| 2003.09 | 112.2 | 48.7 | 59.5 (-0.5) |
| 2003.10 | 151.7 | 65.5 | 58.2 (-1.3) |
| 2003.11 | 140.8 | 67.3 | 56.7 (-1.5) |
| 2003.12 | 114.9 | 46.5 | 54.8 (-1.9) |
| 2004.01 | 114.1 | 37.3 | 52.0 (-2.8) |
| 2004.02 | 107.0 | 45.8 | 49.3 (-2.7) |
| 2004.03 | 112.0 | 49.1 | 47.1 (-2.2) |
| 2004.04 | 101.2 | 39.3 | (44.6 predicted, -2.5) |
| 2004.05 | 99.8 | 41.5 | (40.9 predicted, -3.7) |
| 2004.06 | 97.4 | 43.2 | (38.0 predicted, -2.9) |
| 2004.07 | 119.1 | 51.0 | (36.2 predicted, -1.8) |
| 2004.08 | 109.6 | 40.9 | (34.6 predicted, -1.6) |
| 2004.09 | 103.1 | 27.7 | (32.8 predicted, -1.6) |
| 2004.10 | 89.6 (1) | 15.6 (2) | (30.5 predicted, -2.3) |
1) Running average based on the daily 20:00 UTC observed solar flux value at 2800 MHz.
2) Unofficial, accumulated value based on the Boulder (NOAA/SEC) sunspot number. The official international sunspot number is typically
30-50% less.
This report has been prepared by Jan Alvestad. It is based partly on my own observations and analysis, and partly on data from some of these solar data sources. All time references are to the UTC day. Comments and suggestions are always welcome.
| [DX-Listeners' Club] |