
Last major update issued on October 4, 2004 at 02:25 UTC.
[Solar and geomagnetic data - last month (updated daily)]
[Solar wind and electron fluence charts (updated daily)]
[Solar cycles 21-23 (last update October 2, 2004)]
[Solar cycles 1-20]
[Graphical comparison of cycles 21, 22 and 23 (last update October 2, 2004)]
[Graphical comparison of cycles 2, 10, 13, 17, 20 and 23 (last update October 2, 2004)]
[Historical solar and geomagnetic data charts 1954-2004 (last update August 28,
2004)]
[Archived reports (last update September 27, 2004)]
The geomagnetic field was quiet to active on October 3. Solar wind speed ranged between 333 and 387 km/sec under the influence of a low speed stream from coronal hole CH116.
Solar flux measured at 20h UTC on 2.8 GHz was 89.0. The planetary A
index was 15 (STAR Ap - based on the mean of three hour interval ap indices: 16.0).
Three hour interval K indices: 12344333 (planetary), 02344322 (Boulder).
The background x-ray flux is at the class A5 level.
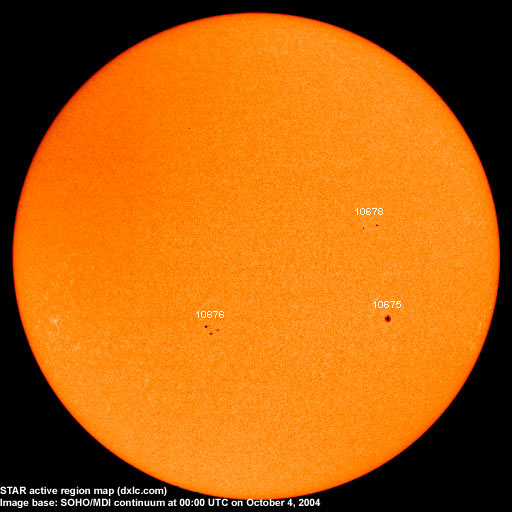
At midnight there were 3 spotted regions on the visible disk. The solar flare activity level was very low. No C class events were recorded during the day.
Region 10675 lost the trailing spots while the single penumbra was mostly unchanged.
Region 10676 developed early in the day as new flux emerged in the southwestern part.
New region 10678 emerged quickly early in the day in the northwest quadrant, then began to decay.
October 1-3: No obviously Earth directed CMEs observed.
Coronal hole history (since late October 2002)
Compare today's report with the situation one solar rotation ago: 28
days ago 27 days ago 26 days ago
A poorly defined trans equatorial coronal hole (CH117) will rotate into a geoeffective position on October 3-4.
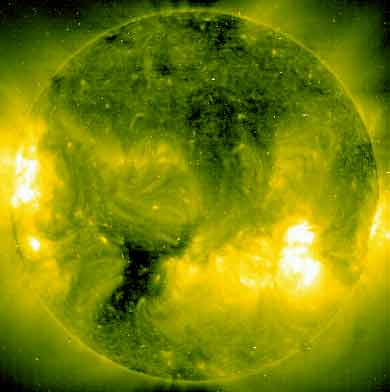
Processed SOHO/EIT 284 image at 19:06 UTC on September 10. The darkest areas on the solar disk are likely coronal holes.
The geomagnetic field is expected to be quiet to unsettled on October 4-5. On October 6-7 a coronal hole flow could cause unsettled to active conditions.
| Coronal holes (1) | Coronal mass ejections (2) | M and X class flares (3) |
1) Effects from a coronal hole could reach Earth within the next 5 days. When the high speed stream has arrived
the color changes to green.
2) Material from a CME is likely to impact Earth within 96 hours.
3) There is a possibility of either M or X class flares within the next 48 hours.
Green: 0-20% probability, Yellow: 20-60% probability, Red: 60-100% probability.
Long distance low and medium frequency (below 2 MHz) propagation along east-west paths over high and upper middle latitudes is poor to very poor. Propagation along long distance north-south paths is fair. Trans Atlantic propagation conditions are monitored every night on 1470 kHz. Dominant stations tonight: Radio Cristal del Uruguay and some unidentified stations from Brazil. A few stations from the Caribbean (Radio Visi�n Cristiana on 530 (strongest signal), Harbour Light on 1400, WDHP on 1620) could be heard, however, most of the trans Atlantic signals were from Brazil. North America was represented by weak and only occasionally audible signals from Newfoundland stations on 620, 750, 800 and 930 kHz.
The local sunrise opening on October 3 was very interesting with lots of frequencies populated by stations from South America and the Caribbean. Several stations from Per� and Ecuador were noted while the Cuban stations were the most numerous. VSB (Bermuda) on 1280 kHz had an excellent signal for a long time.
Compare to the previous day's image.
Data for all numbered solar regions according to the Solar Region Summary provided by NOAA/SEC. Comments are my own, as is the STAR spot count (spots observed at or inside a few hours before midnight) and data for regions not numbered by SEC or where SEC has observed no spots. SEC active region numbers in the table below and in the active region map above are the historic SEC/USAF numbers.
| Active region | Date numbered | SEC spot count |
STAR spot count |
Location at midnight | Area | Classification | Comment |
|---|---|---|---|---|---|---|---|
| 10675 | 2004.09.25 | 2 | 1 | S09W33 | 0070 | HSX | |
| 10676 | 2004.09.28 | 5 | 5 | S12E11 | 0040 | CSO |
classification was DSO at midnight |
| 10677 | 2004.09.28 | N02W34 | plage | ||||
| 10678 | 2004.10.03 | 2 | 2 | N12W29 | 0020 | DSO | |
| S456 | emerged on 2004.09.29 |
N16W08 | plage | ||||
| S457 | emerged on 2004.09.29 |
S08W58 | plage | ||||
| Total spot count: | 9 | 8 | |||||
| SSN: | 39 | 38 | |||||
| Month | Average solar flux at Earth |
International sunspot number | Smoothed sunspot number |
|---|---|---|---|
| 2000.04 | 184.2 | 125.5 | 120.8 cycle 23 sunspot max. |
| 2000.07 | 202.3 | 170.1 | 119.8 |
| 2001.12 | 235.1 | 132.2 | 114.6 (-0.9) |
| 2003.08 | 122.1 | 72.7 | 60.0 (-1.7) |
| 2003.09 | 112.2 | 48.7 | 59.5 (-0.5) |
| 2003.10 | 151.7 | 65.5 | 58.2 (-1.3) |
| 2003.11 | 140.8 | 67.3 | 56.7 (-1.5) |
| 2003.12 | 114.9 | 46.5 | 54.8 (-1.9) |
| 2004.01 | 114.1 | 37.3 | 52.0 (-2.8) |
| 2004.02 | 107.0 | 45.8 | 49.3 (-2.7) |
| 2004.03 | 112.0 | 49.1 | 47.1 (-2.2) |
| 2004.04 | 101.2 | 39.3 | (44.6 predicted, -2.5) |
| 2004.05 | 99.8 | 41.5 | (40.9 predicted, -3.7) |
| 2004.06 | 97.4 | 43.2 | (38.0 predicted, -2.9) |
| 2004.07 | 119.1 | 51.0 | (36.2 predicted, -1.8) |
| 2004.08 | 109.6 | 40.9 | (34.6 predicted, -1.6) |
| 2004.09 | 103.1 | 27.7 | (32.8 predicted, -1.6) |
| 2004.10 | 88.3 (1) | 3.6 (2) | (30.5 predicted, -2.3) |
1) Running average based on the daily 20:00 UTC observed solar flux value at 2800 MHz.
2) Unofficial, accumulated value based on the Boulder (NOAA/SEC) sunspot number. The official international sunspot number is typically
30-50% less.
This report has been prepared by Jan Alvestad. It is based partly on my own observations and analysis, and partly on data from some of these solar data sources. All time references are to the UTC day. Comments and suggestions are always welcome.
| [DX-Listeners' Club] |