
Last major update issued on November 11, 2004 at 04:25 UTC.
[Solar and geomagnetic data - last month (updated daily)]
[Solar wind and electron fluence charts (updated daily)]
[Solar cycles 21-23 (last update November 4, 2004)]
[Solar cycles 1-20]
[Graphical comparison of cycles 21, 22 and 23 (last update November 4, 2004)]
[Graphical comparison of cycles 2, 10, 13, 17, 20 and 23 (last update November
4, 2004)]
[Historical solar and geomagnetic data charts 1954-2004 (last update November 8,
2004)]
[Archived reports (last update November 8, 2004)]
The geomagnetic field was at active to extremely severe storm levels on November 10. Solar wind speed ranged between 551 and 903 km/sec. The planetary A index reached the maximum attainable value of 400 for the 06-09h UTC interval, only two days after the last time this disturbance level was reached. For the 24 hour period starting at 15h UTC on November 9 and ending at 15h UTC on November 10 the planetary A index was 227 (based on preliminary data). Based on NGDC data the current geomagnetic storm would rank as number 12 on the all time list of the most intense geomagnetic storms. The only recent geomagnetic storm to rank higher is the sixth placed storm which started on October 28, 2003.
Solar flux measured at 20h UTC on 2.8 GHz was 104.6. The planetary A
index was 181 (STAR Ap - based on the mean of three hour interval ap indices: 180.9).
Three hour interval K indices: 88997654 (planetary), 77886553 (Boulder).
The background x-ray flux is at the class B2 level.
At midnight there were 3 spotted regions on the visible solar disk. The solar flare activity level was high. A total of 8 C and 1 X class events was recorded during the day.
Region 10696 decayed quickly, particularly in the trailing spot section. While the region still is complex magnetically, and remains capable of producing another major flare, the probability of intense flaring is diminishing. Flare: X2.5/3B at 02:13 UTC. This event was associated with strong type II and IV radio sweeps and a very fast CME.Spotted regions not numbered by NOAA/SEC:
[S473] This region rotated partly into view at the southeast limb on November 10. Location at midnight: S15E80
November 10: Another very fast CME was associated
with the major X2.8 flare in region 10696 early in the day. This CME could reach Earth on November 11.
November 9: A very fast full halo CME was observed after the M8 major flare in region 10696 during the afternoon. This CME
could reach Earth on November 11.
November 8: A full halo CME was observed early in the day after a long duration event in the eastern part of region 10696.
This CME will probably reach Earth on November 11.
Coronal hole history (since late October 2002)
Compare today's report with the situation one solar rotation ago: 28
days ago 27 days ago 26 days ago
Trans equatorial coronal hole CH125 was in a geoeffective position on November 8, however, this coronal hole closed after the long duration event in region 10696 early in the day. Recurrent coronal hole CH126 in the southern hemisphere is poorly defined and will be in a geoeffective position on November 10-11.

Processed SOHO/EIT 284 image at 19:06 UTC on November 10. The darkest areas on the solar disk are likely coronal holes.
The geomagnetic field is expected to be unsettled to severe storm on November 11-12 due to the arrival of 2 or 3 CMEs. Quiet to active is likely on November 13-14.
| Coronal holes (1) | Coronal mass ejections (2) | M and X class flares (3) |
1) Effects from a coronal hole could reach Earth within the next 5 days. When the high speed stream has arrived
the color changes to green.
2) Material from a CME is likely to impact Earth within 96 hours.
3) There is a possibility of either M or X class flares within the next 48 hours.
Green: 0-20% probability, Yellow: 20-60% probability, Red: 60-100% probability.
Long distance low and medium frequency (below 2 MHz) propagation along east-west paths over high and upper middle latitudes is useless. Propagation along long distance north-south paths is poor to fair. Trans Atlantic propagation conditions are normally monitored every night on 1470 kHz. Dominant station tonight: Radio Cristal del Uruguay, occasionally with interference from unidentified Brazilian stations. Otherwise the best signals were noted on 740 (R�dio Sociedade) and 1440 kHz (1440 AM from Rio de Janeiro).
Compare to the previous day's image.
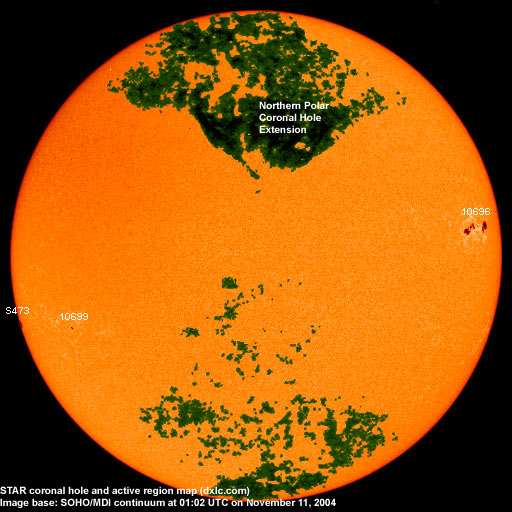
Data for all numbered solar regions according to the Solar Region Summary provided by NOAA/SEC. Comments are my own, as is the STAR spot count (spots observed at or inside a few hours before midnight) and data for regions not numbered by SEC or where SEC has observed no spots. SEC active region numbers in the table below and in the active region map above are the historic SEC/USAF numbers.
| Active region | Date numbered | SEC spot count |
STAR spot count |
Location at midnight | Area | Classification | Comment |
|---|---|---|---|---|---|---|---|
| 10695 | 2004.10.30 | S16W79 | plage | ||||
| 10696 | 2004.11.01 | 29 | 17 | N08W62 | 0470 | EAC |
beta-gamma-delta classification was EAI at midnight, area 0330 |
| 10699 | 2004.11.09 | 1 | 1 | S15E53 | 0030 | HSX | |
| S470 | emerged on 2004.11.06 |
N05W28 | plage | ||||
| S471 | emerged on 2004.11.08 |
N04E10 | plage | ||||
| S472 | emerged on 2004.11.09 |
S12W41 | plage | ||||
| S473 | emerged on 2004.11.09 |
1 | S15E80 | 0100 | HSX | ||
| Total spot count: | 30 | 19 | |||||
| SSN: | 50 | 49 | |||||
| Month | Average solar flux at Earth |
International sunspot number | Smoothed sunspot number |
|---|---|---|---|
| 2000.04 | 184.2 | 125.5 | 120.8 cycle 23 sunspot max. |
| 2000.07 | 202.3 | 170.1 | 119.8 |
| 2001.12 | 235.1 | 132.2 | 114.6 (-0.9) |
| 2003.08 | 122.1 | 72.7 | 60.0 (-1.7) |
| 2003.09 | 112.2 | 48.7 | 59.5 (-0.5) |
| 2003.10 | 151.7 | 65.5 | 58.2 (-1.3) |
| 2003.11 | 140.8 | 67.3 | 56.7 (-1.5) |
| 2003.12 | 114.9 | 46.5 | 54.8 (-1.9) |
| 2004.01 | 114.1 | 37.3 | 52.0 (-2.8) |
| 2004.02 | 107.0 | 45.8 | 49.3 (-2.7) |
| 2004.03 | 112.0 | 49.1 | 47.1 (-2.2) |
| 2004.04 | 101.2 | 39.3 | 45.5 (-1.6) |
| 2004.05 | 99.8 | 41.5 | (42.8 predicted, -2.7) |
| 2004.06 | 97.4 | 43.2 | (40.0 predicted, -2.8) |
| 2004.07 | 119.1 | 51.0 | (38.2 predicted, -1.8) |
| 2004.08 | 109.6 | 40.9 | (36.6 predicted, -1.6) |
| 2004.09 | 103.1 | 27.7 | (34.7 predicted, -1.9) |
| 2004.10 | 105.9 | 48.4 | (32.5 predicted, -2.2) |
| 2004.11 | 129.6 (1) | 34.3 (2) | (31.0 predicted, -1.5) |
1) Running average based on the daily 20:00 UTC observed solar flux value at 2800 MHz.
2) Unofficial, accumulated value based on the Boulder (NOAA/SEC) sunspot number. The official international sunspot number is typically
30-50% less.
This report has been prepared by Jan Alvestad. It is based partly on my own observations and analysis, and partly on data from some of these solar data sources. All time references are to the UTC day. Comments and suggestions are always welcome.
| [DX-Listeners' Club] |