
Last major update issued on November 5, 2004 at 02:30 UTC.
[Solar and geomagnetic data - last month (updated daily)]
[Solar wind and electron fluence charts (updated daily)]
[Solar cycles 21-23 (last update November 4, 2004)]
[Solar cycles 1-20]
[Graphical comparison of cycles 21, 22 and 23 (last update November 4, 2004)]
[Graphical comparison of cycles 2, 10, 13, 17, 20 and 23 (last update November
4, 2004)]
[Historical solar and geomagnetic data charts 1954-2004 (last update August 28,
2004)]
[Archived reports (last update November 4, 2004)]
The geomagnetic field was quiet to unsettled on November 4. Solar wind speed ranged between 391 and 448 km/sec. After a peak at 04h UTC, solar wind speed decreased gradually for the remainder of the day.
Solar flux measured at 20h UTC on 2.8 GHz was 136.0. The planetary A
index was 7 (STAR Ap - based on the mean of three hour interval ap indices: 7.4).
Three hour interval K indices: 12211322 (planetary), 22322232 (Boulder).
The background x-ray flux is at the class C1 level.
At midnight there were 3 spotted regions on the visible solar disk. The solar flare activity level was high. A total of 6 C and 2 M class events was recorded during the day. Region 10691 at the northwest limb produced a C1.1 flare at 08:24 UTC.
Region 10693 decayed slowly and quietly. The region has a fairly simple structure magnetically.
November 4: Two full halo CMEs was observed during the day. The first one was after a long duration C6 event in region
10696 in the morning. This CME, is not overtaken by the larger CME observed later in the day, is likely to reach Earth either late
on November 6 or early on November 7. The second CME was associated with a major long duration event in region 10696 late in the
day. This was a fast, large, full halo CME, and it is likely to reach Earth either late on November 6 or during the first half of
November 7.
November 3: A halo CME was observed after an M1 event in region 10696 early in the day. While this CME was not aimed
directly at Earth, a sideways glancing impact is possible late on November 5 or on November 6. A large, fast, full halo CME was
observed after an M5 event in region 10696 during the afternoon. Again, this CME was not aimed directly at Earth. However, much
more mass was observed over the west limbs compared to the event earlier in the day. This CME is likely to impact Earth's
magnetosphere sometime between noon on November 5 and noon on November 6 and cause active to major storm conditions.
November 2: No obviously Earth directed CMEs observed.
Coronal hole history (since late October 2002)
Compare today's report with the situation one solar rotation ago: 28
days ago 27 days ago 26 days ago
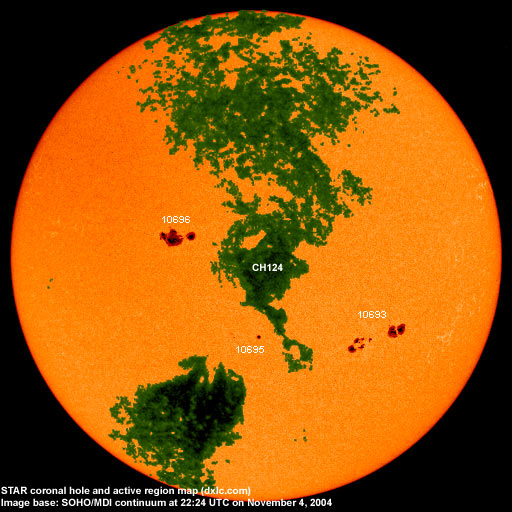
An extension (CH123) of the northern polar coronal hole was in a geoeffective position on November 3. A recurrent coronal hole (CH124) in the southern hemisphere was in a geoeffective position on November 4-5.
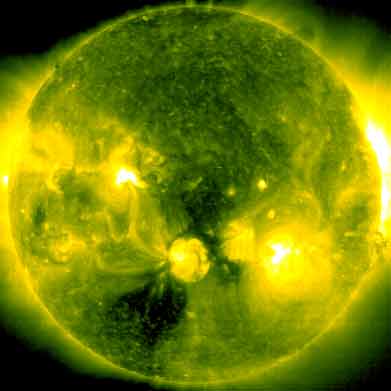
Processed SOHO/EIT 284 image at 19:06 UTC on November 4. The darkest areas on the solar disk are likely coronal holes.
The geomagnetic field is expected to be quiet to unsettled on November 5 until the arrival of CMEs observed on November 3 that day or on November 6. Active to major storm is likely on November 6 becoming minor to severe storm late in the day or early on November 7. Coronal hole effects from CH123 and CH124 are possible on November 7-8 but may pass unnoticed due to multiple CME impacts.
| Coronal holes (1) | Coronal mass ejections (2) | M and X class flares (3) |
1) Effects from a coronal hole could reach Earth within the next 5 days. When the high speed stream has arrived
the color changes to green.
2) Material from a CME is likely to impact Earth within 96 hours.
3) There is a possibility of either M or X class flares within the next 48 hours.
Green: 0-20% probability, Yellow: 20-60% probability, Red: 60-100% probability.
Long distance low and medium frequency (below 2 MHz) propagation along east-west paths over high and upper middle latitudes is poor to very poor. Propagation along long distance north-south paths is poor. Trans Atlantic propagation conditions are normally monitored every night on 1470 kHz. Dominant stations tonight: Radio Vibraci�n (Venezuela). From North America only a few weak signals could be heard from Newfoundland stations.
Compare to the previous day's image.
Data for all numbered solar regions according to the Solar Region Summary provided by NOAA/SEC. Comments are my own, as is the STAR spot count (spots observed at or inside a few hours before midnight) and data for regions not numbered by SEC or where SEC has observed no spots. SEC active region numbers in the table below and in the active region map above are the historic SEC/USAF numbers.
| Active region | Date numbered | SEC spot count |
STAR spot count |
Location at midnight | Area | Classification | Comment |
|---|---|---|---|---|---|---|---|
| 10691 | 2004.10.23 | 3 | N13W94 | 0090 | DAO | rotated out of view | |
| 10693 | 2004.10.27 | 46 | 28 | S15W31 | 0600 | FKC |
classification was EKO at midnight |
| 10694 | 2004.10.28 | N14W68 | plage | ||||
| 10695 | 2004.10.30 | 5 | 6 | S14E01 | 0030 | CAO |
classification was CSO at midnight |
| 10696 | 2004.11.01 | 41 | 34 | N09E19 | 0580 | DKC |
beta-delta very high flare potential area was 0800 at midnight |
| Total spot count: | 95 | 68 | |||||
| SSN: | 135 | 98 | |||||
| Month | Average solar flux at Earth |
International sunspot number | Smoothed sunspot number |
|---|---|---|---|
| 2000.04 | 184.2 | 125.5 | 120.8 cycle 23 sunspot max. |
| 2000.07 | 202.3 | 170.1 | 119.8 |
| 2001.12 | 235.1 | 132.2 | 114.6 (-0.9) |
| 2003.08 | 122.1 | 72.7 | 60.0 (-1.7) |
| 2003.09 | 112.2 | 48.7 | 59.5 (-0.5) |
| 2003.10 | 151.7 | 65.5 | 58.2 (-1.3) |
| 2003.11 | 140.8 | 67.3 | 56.7 (-1.5) |
| 2003.12 | 114.9 | 46.5 | 54.8 (-1.9) |
| 2004.01 | 114.1 | 37.3 | 52.0 (-2.8) |
| 2004.02 | 107.0 | 45.8 | 49.3 (-2.7) |
| 2004.03 | 112.0 | 49.1 | 47.1 (-2.2) |
| 2004.04 | 101.2 | 39.3 | 45.5 (-1.6) |
| 2004.05 | 99.8 | 41.5 | (42.8 predicted, -2.7) |
| 2004.06 | 97.4 | 43.2 | (40.0 predicted, -2.8) |
| 2004.07 | 119.1 | 51.0 | (38.2 predicted, -1.8) |
| 2004.08 | 109.6 | 40.9 | (36.6 predicted, -1.6) |
| 2004.09 | 103.1 | 27.7 | (34.7 predicted, -1.9) |
| 2004.10 | 105.9 | 48.4 | (32.5 predicted, -2.2) |
| 2004.11 | 135.1 (1) | 17.1 (2) | (31.0 predicted, -1.5) |
1) Running average based on the daily 20:00 UTC observed solar flux value at 2800 MHz.
2) Unofficial, accumulated value based on the Boulder (NOAA/SEC) sunspot number. The official international sunspot number is typically
30-50% less.
This report has been prepared by Jan Alvestad. It is based partly on my own observations and analysis, and partly on data from some of these solar data sources. All time references are to the UTC day. Comments and suggestions are always welcome.
| [DX-Listeners' Club] |