
Last major update issued on May 15, 2004 at 04:05 UTC.
[Solar and geomagnetic data - last month (updated daily)]
[Solar wind and electron fluence charts (updated daily)]
[Solar cycles 21-23 (last update May 3, 2004)]
[Solar cycles 1-20]
[Graphical comparison of cycles 21, 22 and 23 (last update May 3, 2004)]
[Graphical comparison of cycles 2, 10, 13, 17, 20 and 23 (last update May 3, 2004)]
[Historical solar and geomagnetic data charts 1954-2004 (last update April 28,
2004)]
[Archived reports (last update May 8, 2004)]
The geomagnetic field was quiet to unsettled on May 14. Solar wind speed ranged between 319 and 435 km/sec, generally decreasing all day. A slow solar wind disturbance arrived at ACE at about 16h UTC. The interplanetary magnetic field had a sustained moderately southwards interval from 22:30 UTC until just after midnight. This caused the geomagnetic field to become active early on May 15.
Solar flux measured at 20h UTC on 2.8 GHz was 109.6. The planetary A
index was 8 (STAR Ap - based on the mean of three hour interval ap indices: 9.0).
Three hour interval K indices: 23113222 (planetary), 33201022 (Boulder).
The background x-ray flux is at the class B2 level.
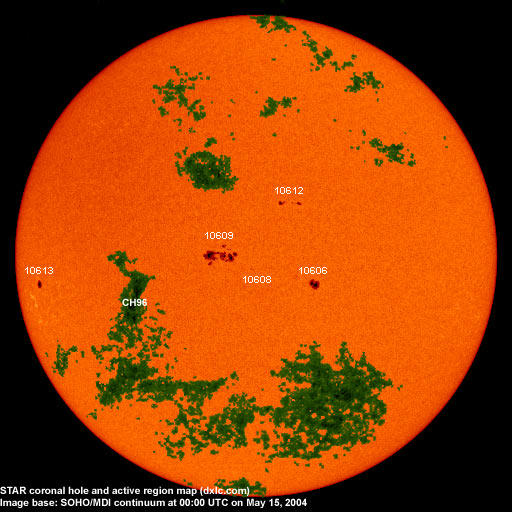
At midnight there were 5 spotted regions on the visible disk. The solar flare activity level was very low. No C class events were recorded during the day.
Region 10606 decayed with the large penumbra losing a significant part of its area. Some small trailing spots
reemerged.
Region 10608 decayed and was spotless before noon, then some tiny spots reemerged.
Region 10609 continued to develop quickly and more than doubled the penumbral area. A magnetic delta structure has formed
in the central part of the region. A minor M class flare is likely and there is a chance of a major flare.
Region 10612 developed moderately quickly adding several spots in both polarities.
Region 10613 was quiet and stable.
May 12-14: No fully or partly Earth directed CME observed.
Coronal hole history (since late October 2002)
Compare today's report with the situation one solar rotation ago: 28
days ago 27 days ago 26 days ago
A recurrent coronal hole (CH96) in the southern hemisphere will likely rotate into a geoeffective position on May 17.

Processed SOHO/EIT 284 image at 01:05 UTC on May 15. The darkest areas on the solar disk are likely coronal holes.
The geomagnetic field is expected to be quiet to active on May 15 and quiet to unsettled on May 16-17.
| Coronal holes (1) | Coronal mass ejections (2) | M and X class flares (3) |
1) Effects from a coronal hole could reach Earth within the next 5 days. When the high speed stream has arrived
the color changes to green.
2) Material from a CME is likely to impact Earth within 96 hours.
3) There is a possibility of either M or X class flares within the next 48 hours.
Green: 0-20% probability, Yellow: 20-60% probability, Red: 60-100% probability.
Long distance low and medium frequency (below 2 MHz) propagation along east-west paths over high and upper middle latitudes is very poor. Propagation along long distance north-south paths is fair. Trans Atlantic propagation conditions are monitored every night on 1470 kHz. Dominant station tonight: Radio Vibraci�n (Venezuela). While WWZN Boston on 1510 kHz managed to get through tonight as well, propagation was better on more southern paths with stations from Brazil noted on several frequencies (including 1100, 1230, 1350 and 1440 kHz).
Compare to the previous day's image.
Data for all numbered solar regions according to the Solar Region Summary provided by NOAA/SEC. Comments are my own, as is the STAR spot count (spots observed at or inside a few hours before midnight) and data for regions not numbered by SEC or where SEC has observed no spots. SEC active region numbers in the table below and in the active region map above are the historic SEC/USAF numbers.
| Active region | Date numbered | SEC spot count |
STAR spot count |
Location at midnight | Area | Classification | Comment |
|---|---|---|---|---|---|---|---|
| 10606 | 2004.05.07 | 9 | 7 | S10W13 | 0220 | CKO |
classification was CAO at midnight, area 0140 |
| 10607 | 2004.05.09 | S11W65 | plage | ||||
| 10608 | 2004.05.09 | 2 | 3 | S06E03 | 0010 | BXO | |
| 10609 | 2004.05.10 | 28 | 52 | S03E24 | 0230 | DAC |
beta-gamma-delta classification was DKC at midnight, area 0580 |
| 10610 | 2004.05.12 | S01W11 | plage | ||||
| 10611 | 2004.05.12 | S12W40 | plage | ||||
| 10612 | 2004.05.13 | 8 | 12 | N10W08 | 0040 | DAO |
area was 0060 at midnight |
| 10613 | 2004.05.13 | 1 | 1 | S08E64 | 0050 | HSX |
area was 0080 at midnight |
| S402 | emerged on 2004.05.13 |
N02W15 | plage | ||||
| Total spot count: | 48 | 75 | |||||
| SSN: | 98 | 125 | |||||
| Month | Average solar flux at Earth |
International sunspot number | Smoothed sunspot number |
|---|---|---|---|
| 2000.04 | 184.2 | 125.5 | 120.8 cycle 23 sunspot max. |
| 2000.07 | 202.3 | 170.1 | 119.8 |
| 2001.12 | 235.1 | 132.2 | 114.6 (-0.9) |
| 2003.04 | 126.4 | 60.0 | 70.1 (-3.9) |
| 2003.05 | 115.7 | 55.2 | 67.6 (-2.5) |
| 2003.06 | 129.3 | 77.4 | 65.0 (-2.6) |
| 2003.07 | 127.7 | 83.3 | 61.8 (-3.2) |
| 2003.08 | 122.1 | 72.7 | 60.0 (-1.8) |
| 2003.09 | 112.2 | 48.7 | 59.5 (-0.5) |
| 2003.10 | 151.7 | 65.5 | 58.1 (-1.4) |
| 2003.11 | 140.8 | 67.3 | (56.5 predicted, -1.6) |
| 2003.12 | 114.9 | 46.5 | (53.5 predicted, -3.0) |
| 2004.01 | 114.1 | 37.2 | (49.1 predicted, -4.4) |
| 2004.02 | 107.0 | 46.0 | (44.8 predicted, -4.3) |
| 2004.03 | 112.0 | 48.9 | (42.1 predicted, -2.7) |
| 2004.04 | 101.2 | 39.3 | (40.0 predicted, -2.1) |
| 2004.05 | 93.1 (1) | 26.2 (2) | (36.8 predicted, -3.2) |
1) Running average based on the daily 20:00 UTC observed solar flux value at 2800 MHz.
2) Unofficial, accumulated value based on the Boulder (NOAA/SEC) sunspot number. The official international sunspot number is typically
30-50% less.
This report has been prepared by Jan Alvestad. It is based partly on my own observations and analysis, and partly on data from some of these solar data sources. All time references are to the UTC day. Comments and suggestions are always welcome.
| [DX-Listeners' Club] |