
Last major update issued on May 2, 2004 at 04:40 UTC.
[Solar and geomagnetic data - last month (updated daily)]
[Solar wind and electron fluence charts (updated daily)]
[Solar cycles 21-23 (last update April 2, 2004)]
[Solar cycles 1-20]
[Graphical comparison of cycles 21, 22 and 23 (last update April 2, 2004)]
[Graphical comparison of cycles 2, 10, 13, 17, 20 and 23 (last update April 2, 2004)]
[Historical solar and geomagnetic data charts 1954-2004 (last update April 28,
2004)]
[Archived reports (last update April 30, 2004)]
The geomagnetic field was unsettled on May 1. Solar wind speed ranged between 358 and 454 km/sec.
Solar flux measured at 20h UTC on 2.8 GHz was 94.2. The planetary A
index was 13 (STAR Ap - based on the mean of three hour interval ap indices: 13.5).
Three hour interval K indices: 33333333 (planetary), 33232313 (Boulder).
The background x-ray flux is at the class B2 level.
At midnight there were 4 spotted regions on the visible disk. The solar flare activity level was low. A total of 2 C class events was recorded during the day.
Region 10599 decayed quietly and could become spotless today.
Region 10601 developed quickly and has mixed polarities. An M class flare is likely. Flares:
C2.8 at 13:55 and C9.5 at 15:36 UTC.
Region 10602 decayed quietly and could become spotless today.
New region 10603 emerged quickly early in the day just south of region 10601. C flares are possible.
April 29 - May 1: No fully or partly Earth directed CME observed. A halo CME was observed late on April 29 with ejected material first becoming visible off of the southern limbs and the south pole. This CME most likely had a backsided origin.
Coronal hole history (since late October 2002)
Compare today's report with the situation one solar rotation ago: 28
days ago 27 days ago 26 days ago
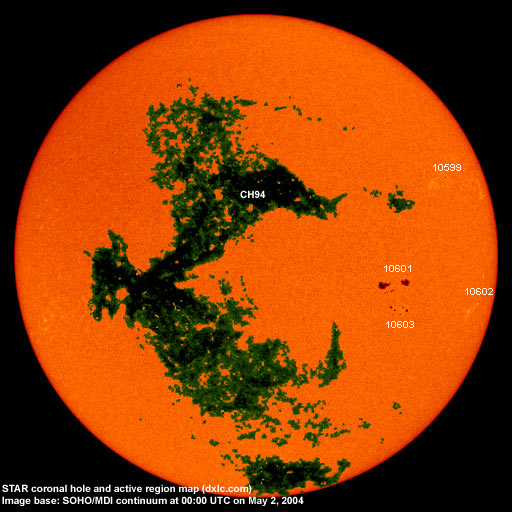
A small recurrent coronal hole (CH93) in the northern hemisphere was in a geoeffective position on April 29 and early on April 30. A large trans equatorial coronal hole (CH94) - the recurrent eastern part of what was CH88 during the previous rotation - will be in a geoeffective position on April 30 - May 4.

Processed SOHO/EIT 284 image at 19:05 UTC on May 1. The darkest areas on the solar disk are likely coronal holes.
The geomagnetic field is expected to be unsettled to active on May 2-7 due to high speed streams from coronal holes CH93 and CH94. Occasional minor storm intervals are possible on May 3-4.
| Coronal holes (1) | Coronal mass ejections (2) | M and X class flares (3) |
1) Effects from a coronal hole could reach Earth within the next 5 days. When the high speed stream has arrived
the color changes to green.
2) Material from a CME is likely to impact Earth within 96 hours.
3) There is a possibility of either M or X class flares within the next 48 hours.
Green: 0-20% probability, Yellow: 20-60% probability, Red: 60-100% probability.
Long distance low and medium frequency (below 2 MHz) propagation along east-west paths over high and upper middle latitudes is poor. Propagation along long distance north-south paths is fair to poor. Trans Atlantic propagation conditions are monitored every night on 1470 kHz. Dominant stations tonight: Radio Vibraci�n (Venezuela) from 23 until 02h UTC, then gradually CPN Radio (Per�) got the better signal. A couple of interesting unidentified stations from South America were noted on 790 and 620 kHz just after local sunrise. Only a few stations from North America could be heard, 1510 WWZN had the best signal along with 930 CJYQ].
Compare to the previous day's image.
Data for all numbered solar regions according to the Solar Region Summary provided by NOAA/SEC. Comments are my own, as is the STAR spot count (spots observed at or inside a few hours before midnight) and data for regions not numbered by SEC or where SEC has observed no spots. SEC active region numbers in the table below and in the active region map above are the historic SEC/USAF numbers.
| Active region | Date numbered | SEC spot count |
STAR spot count |
Location at midnight | Area | Classification | Comment |
|---|---|---|---|---|---|---|---|
| 10599 | 2004.04.24 | 3 | 1 | N17W54 | 0030 | CSO |
classification was AXX at midnight, area 0010 |
| 10600 | 2004.04.26 | N18W58 | plage | ||||
| 10601 | 2004.04.30 | 10 | 23 | S09W34 | 0090 | DSO |
beta-gamma classification was DKI at midnight, area 0350, location S10W35 |
| 10602 | 2004.04.30 | 6 | 1 | S13W66 | 0030 | BXO |
classification was AXX at midnight, area 0010 |
| 10603 | 2004.05.01 | 6 | 10 | S15W37 | 0020 | CSO |
classification was DSI at midnight, area 0060, location S16W38 |
| Total spot count: | 25 | 35 | |||||
| SSN: | 65 | 75 | |||||
| Month | Average solar flux at Earth |
International sunspot number | Smoothed sunspot number |
|---|---|---|---|
| 2000.04 | 184.2 | 125.5 | 120.8 cycle 23 sunspot max. |
| 2000.07 | 202.3 | 170.1 | 119.8 |
| 2001.12 | 235.1 | 132.2 | 114.6 (-0.9) |
| 2003.03 | 131.4 | 61.1 | 74.0 (-4.3) |
| 2003.04 | 126.4 | 60.0 | 70.1 (-3.9) |
| 2003.05 | 115.7 | 55.2 | 67.6 (-2.5) |
| 2003.06 | 129.3 | 77.4 | 65.0 (-2.6) |
| 2003.07 | 127.7 | 83.3 | 61.8 (-3.2) |
| 2003.08 | 122.1 | 72.7 | 60.0 (-1.8) |
| 2003.09 | 112.2 | 48.7 | 59.5 (-0.5) |
| 2003.10 | 151.7 | 65.5 | 58.1 (-1.4) |
| 2003.11 | 140.8 | 67.3 | (56.5 predicted, -1.6) |
| 2003.12 | 114.9 | 46.5 | (53.5 predicted, -3.0) |
| 2004.01 | 114.1 | 37.2 | (49.1 predicted, -4.4) |
| 2004.02 | 107.0 | 46.0 | (44.8 predicted, -4.3) |
| 2004.03 | 112.0 | 48.9 | (42.1 predicted, -2.7) |
| 2004.04 | 101.2 | 39.3 | (40.0 predicted, -2.1) |
| 2004.05 | 94.2 (1) | 2.1 (2) | (36.8 predicted, -3.2) |
1) Running average based on the daily 20:00 UTC observed solar flux value at 2800 MHz.
2) Unofficial, accumulated value based on the Boulder (NOAA/SEC) sunspot number. The official international sunspot number is typically
30-50% less.
This report has been prepared by Jan Alvestad. It is based partly on my own observations and analysis, and partly on data from some of these solar data sources. All time references are to the UTC day. Comments and suggestions are always welcome.
| [DX-Listeners' Club] |