
Last major update issued on March 27, 2004 at 05:55 UTC.
[Solar and geomagnetic data - last month (updated daily)]
[Solar wind and electron fluence charts (updated daily)]
[Solar cycles 21-23 (last update March 2, 2004)]
[Solar cycles 1-20]
[Graphical comparison of cycles 21, 22 and 23 (last update March 2, 2004)]
[Graphical comparison of cycles 2, 10, 13, 17, 20 and 23 (last update March 2, 2004)]
[Historical solar and geomagnetic data charts 1954-2003 (last update January 16,
2004)]
[Archived reports (last update March 11, 2004)]
The geomagnetic field was quiet to active on March 26. Solar wind speed ranged between 399 and 547 km/sec. A high speed stream arrived at Earth at about 10h UTC and caused a marked increase in geomagnetic field activity after noon. The source of the high speed stream is probably a fairly small coronal hole in the southern hemisphere.
Solar flux measured at 20h UTC on 2.8 GHz was 123.8. The planetary A
index was 11 (STAR Ap - based on the mean of three hour interval ap indices: 11.5).
Three hour interval K indices: 11214333 (planetary), 22213434 (Boulder).
The background x-ray flux is at the class B3 level.
At midnight there were 8 spotted regions on the visible disk. The solar flare activity level was very low. No C class events was recorded during the day.
Region 10574 decayed quickly and lost most of the spots and all penumbra on the trailing spots.
Region 10577 decayed slowly and quietly.
Region 10578 developed quickly and was quiet.
Region 10581 was quiet and stable.
Region 10582 was mostly unchanged and has a fairly strong magnetic delta structure in the large main penumbra. The leading
positive polarity area is split into two by a narrow strip of negative polarity. A major flare is possible.
Spotted regions not numbered by NOAA/SEC:
[S377] This region emerged in the northwest quadrant on March 25 and did not change much on March 26. Location at midnight:
N08W54.
[S378] A new region emerged in the southeast quadrant on March 25 and developed slowly on March 26. Location at midnight:
S13E34.
[S379] This region rotated into view at the southeast limb on March 25 and developed slowly on March 26. Location at midnight:
S15E62.
March 24-26: No partly or fully earth directed CMEs observed in limited LASCO data.
Coronal hole history (since late October 2002)
Compare today's report with the situation one solar rotation ago: 28
days ago 27 days ago 26 days ago
A recurrent coronal hole (CH87) in the northern hemisphere will be in a geoeffective position on March 25-27.

Processed SOHO/EIT 284 image at 00:12 UTC on March 18. The darkest areas on the solar disk are likely coronal holes.
The geomagnetic field is expected to be unsettled to active on March 27 and unsettled to minor storm on March 28-29 due to a high speed stream from coronal hole CH87.
Long distance low and medium frequency (below 2 MHz) propagation along east-west paths over high and upper middle latitudes is poor. Propagation along long distance north-south paths is poor. [Trans Atlantic propagation conditions are currently monitored every night on 1470 kHz. Dominant stations tonight: Radio Vibraci�n (Venezuela) and CPN Radio (Per�). Most of the usual Newfoundland stations were heard weakly on other frequencies and a few of the frequently heard US east coast stations were noted as well].
| Coronal holes (1) | Coronal mass ejections (2) | M and X class flares (3) |
1) Effects from a coronal hole could reach Earth within the next 5 days. When the high speed stream has arrived
the color changes to green.
2) Material from a CME is likely to impact Earth within 96 hours.
3) There is a possibility of either M or X class flares within the next 48 hours.
Green: 0-20% probability, Yellow: 20-60% probability, Red: 60-100% probability.
Compare to the previous day's image.
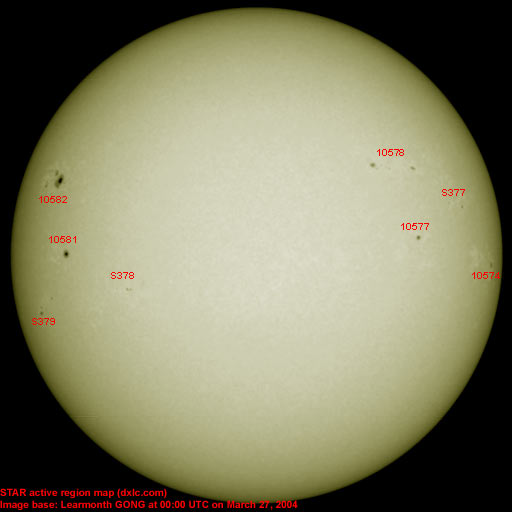
Data for all numbered solar regions according to the Solar Region Summary provided by NOAA/SEC. Comments are my own, as is the STAR spot count (spots observed at or inside a few hours before midnight) and data for regions not numbered by SEC or where SEC has observed no spots. SEC active region numbers in the table below and in the active region map above are the historic SEC/USAF numbers.
| Active region | Date numbered | SEC spot count |
STAR spot count |
Location at midnight | Area | Classification | Comment |
|---|---|---|---|---|---|---|---|
| 10574 | 2004.03.16 | 13 | 4 | S04W65 | 0070 | EAO |
classification was CAO at midnight, area 0040 |
| 10577 | 2004.03.17 | 6 | 2 | N00W38 | 0060 | CSO | |
| 10578 | 2004.03.18 | 18 | 13 | N15W34 | 0150 | EAO | |
| 10579 | 2004.03.22 | S13W06 | plage | ||||
| 10580 | 2004.03.24 | S06W34 | plage | ||||
| 10581 | 2004.03.24 | 4 | 1 | S03E53 | 0140 | CSO |
classification was HSX at midnight |
| 10582 | 2004.03.25 | 9 | 18 | N16E59 | 0250 | DAI |
beta-delta classification was DKC at midnight, area 0360 |
| S377 | emerged on 2004.03.25 |
2 | N08W54 | 0030 | CAO | ||
| S378 | emerged on 2004.03.25 |
6 | S13E34 | 0030 | CRO | ||
| S379 | visible on 2004.03.25 |
5 | S15E62 | 0050 | CSO | ||
| Total spot count: | 50 | 51 | |||||
| SSN: | 100 | 131 | |||||
| Month | Average solar flux at Earth |
International sunspot number | Smoothed sunspot number |
|---|---|---|---|
| 2000.04 | 184.2 | 125.5 | 120.8 cycle 23 sunspot max. |
| 2000.07 | 202.3 | 170.1 | 119.8 |
| 2001.12 | 235.1 | 132.2 | 114.6 (-0.9) |
| 2003.02 | 124.5 | 46.0 | 78.3 (-2.5) |
| 2003.03 | 131.4 | 61.1 | 74.0 (-4.3) |
| 2003.04 | 126.4 | 60.0 | 70.1 (-3.9) |
| 2003.05 | 115.7 | 55.2 | 67.6 (-2.5) |
| 2003.06 | 129.3 | 77.4 | 65.0 (-2.6) |
| 2003.07 | 127.7 | 83.3 | 61.8 (-3.2) |
| 2003.08 | 122.1 | 72.7 | 60.0 (-1.8) |
| 2003.09 | 112.2 | 48.7 | (58.9 predicted, -1.1) |
| 2003.10 | 151.7 | 65.5 | (56.2 predicted, -2.7) |
| 2003.11 | 140.8 | 67.3 | (53.5 predicted, -2.7) |
| 2003.12 | 114.9 | 46.5 | (50.9 predicted, -2.6) |
| 2004.01 | 114.1 | 37.2 | (46.7 predicted, -4.2) |
| 2004.02 | 107.0 | 46.0 | (42.1 predicted, -4.6) |
| 2004.03 | 109.2 (1) | 60.4 (2) | (39.7 predicted, -2.4) |
1) Running average based on the daily 20:00 UTC observed solar flux value at 2800 MHz.
2) Unofficial, accumulated value based on the Boulder (NOAA/SEC) sunspot number. The official international sunspot number is typically
30-50% less.
This report has been prepared by Jan Alvestad. It is based partly on my own observations and analysis, and partly on data from some of these solar data sources. All time references are to the UTC day. Comments and suggestions are always welcome.
| [DX-Listeners' Club] |