
Last major update issued on March 20, 2004 at 04:40 UTC.
[Solar and geomagnetic data - last month (updated daily)]
[Solar wind and electron fluence charts (updated daily)]
[Solar cycles 21-23 (last update March 2, 2004)]
[Solar cycles 1-20]
[Graphical comparison of cycles 21, 22 and 23 (last update March 2, 2004)]
[Graphical comparison of cycles 2, 10, 13, 17, 20 and 23 (last update March 2, 2004)]
[Historical solar and geomagnetic data charts 1954-2003 (last update January 16,
2004)]
[Archived reports (last update March 11, 2004)]
The geomagnetic field was quiet to unsettled on March 19. Solar wind speed ranged between 306 and 436 km/sec. A slow and gradual increase in speed was observed during the latter half of the day as the Earth came under the influence of the outer edges of a high speed stream from coronal hole CH86.
Solar flux measured at 20h UTC on 2.8 GHz was 112.2. The planetary A
index was 6 (STAR Ap - based on the mean of three hour interval ap indices: 7.4).
Three hour interval K indices: 23022222 (planetary), 23122312 (Boulder).
The background x-ray flux is at the class B4 level.
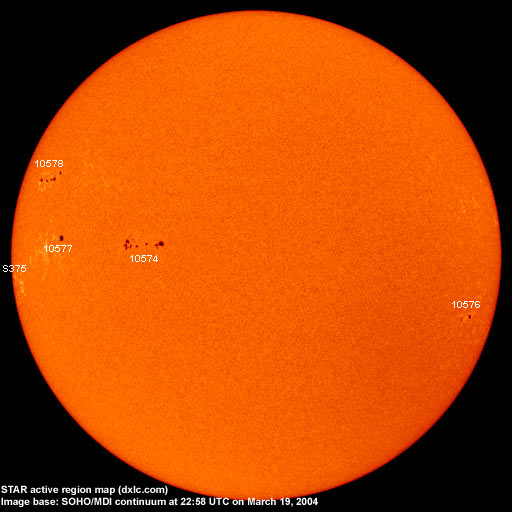
At midnight there were 5 spotted regions on the visible disk. The solar flare activity level was low. A total of 17 C class events was recorded during the day.
Region 10574 decayed significantly in the intermediate spot section. The region has become magnetically much simpler and
has only a minor chance of producing a small M class event. Flares: C1.2 at 04:16 and C2.4 at
08:48 UTC.
Region 10576 decayed and lost nearly all penumbra on the trailing spots.
Region 10577 was quiet and stable.
Region 10578 added several spots, however, the opposite polarity fields separated somewhat. While the fields are still
narrowly separated in the central part of the region, the magnetic delta structure observed there one day ago has disappeared.
Minor M class flares are possible. Flares: C2.3 at 00:18, C1.8 at 01:17, C1.0 at 01:38, C2.0
at 02:36, C1.4 at 03:06, C1.0 at 04:38, C1.0 at 06:14, C1.1 at 07:44, C1.7 at 10:12, C1.4 at 10:42, C1.7 at 12:25, C2.5 at 13:17,
C1.6 at 16:37, C1.0 at 18:32 and C1.3 (flare began at 23:40 UTC) peaking at 00:03 UTC on March 20.
Spotted regions not numbered by NOAA/SEC:
[S375] This region rotated partly into view late on March 19 at the southeast limb. Location at midnight: S10E83.
March 17-19: No partly or fully earth directed CMEs observed.
Coronal hole history (since late October 2002)
Compare today's report with the situation one solar rotation ago: 28
days ago 27 days ago 26 days ago
A recurrent, poorly defined coronal hole (CH85) in the northern hemisphere will rotate into a geoeffective position on March 20. The southernmost parts of a coronal hole (CH86) in the northern hemisphere were in a geoeffective position on March 16-17.

Processed SOHO/EIT 284 image at 00:12 UTC on March 18. The darkest areas on the solar disk are likely coronal holes.
The geomagnetic field is expected to be quiet to active on March 20 and quiet to unsettled on March 21-23.
Long distance low and medium frequency (below 2 MHz) propagation along east-west paths over high and upper middle latitudes is poor. Propagation along long distance north-south paths is fair to poor. [Trans Atlantic propagation conditions are currently monitored every night on 1470 kHz. Dominant station tonight: Radio Vibraci�n (Venezuela). Propagation was fair early on (02 UTC) and became poor as the coronal hole high speed stream increased its influence on the geomagnetic field].
| Coronal holes (1) | Coronal mass ejections (2) | M and X class flares (3) |
1) Effects from a coronal hole could reach Earth within the next 5 days. When the high speed stream has arrived
the color changes to green.
2) Material from a CME is likely to impact Earth within 96 hours.
3) There is a possibility of either M or X class flares within the next 48 hours.
Green: 0-20% probability, Yellow: 20-60% probability, Red: 60-100% probability.
Compare to the previous day's image.
Data for all numbered solar regions according to the Solar Region Summary provided by NOAA/SEC. Comments are my own, as is the STAR spot count (spots observed at or inside a few hours before midnight) and data for regions not numbered by SEC or where SEC has observed no spots. SEC active region numbers in the table below and in the active region map above are the historic SEC/USAF numbers.
| Active region | Date numbered | SEC spot count |
STAR spot count |
Location at midnight | Area | Classification | Comment |
|---|---|---|---|---|---|---|---|
| 10573 | 2004.03.12 | 1 | S12W22 | 0010 | AXX | spotless | |
| 10574 | 2004.03.16 | 20 | 24 | S04E28 | 0140 | DAC |
classification was EAO at midnight |
| 10575 | 2004.03.17 | S18W28 | plage | ||||
| 10576 | 2004.03.17 | 6 | 4 | S18W65 | 0050 | DAO |
classification was DSO at midnight |
| 10577 | 2004.03.17 | 1 | 1 | S01E52 | 0070 | HSX | |
| 10578 | 2004.03.18 | 11 | 16 | N15E60 | 0080 | DAO |
beta-gamma classification was DAI at midnight |
| S375 | visible on 2004.03.19 |
1 | S10E83 | 0020 | HSX | ||
| Total spot count: | 39 | 46 | |||||
| SSN: | 89 | 96 | |||||
| Month | Average solar flux at Earth |
International sunspot number | Smoothed sunspot number |
|---|---|---|---|
| 2000.04 | 184.2 | 125.5 | 120.8 cycle 23 sunspot max. |
| 2000.07 | 202.3 | 170.1 | 119.8 |
| 2001.12 | 235.1 | 132.2 | 114.6 (-0.9) |
| 2003.02 | 124.5 | 46.0 | 78.3 (-2.5) |
| 2003.03 | 131.4 | 61.1 | 74.0 (-4.3) |
| 2003.04 | 126.4 | 60.0 | 70.1 (-3.9) |
| 2003.05 | 115.7 | 55.2 | 67.6 (-2.5) |
| 2003.06 | 129.3 | 77.4 | 65.0 (-2.6) |
| 2003.07 | 127.7 | 83.3 | 61.8 (-3.2) |
| 2003.08 | 122.1 | 72.7 | 60.0 (-1.8) |
| 2003.09 | 112.2 | 48.7 | (58.9 predicted, -1.1) |
| 2003.10 | 151.7 | 65.5 | (56.2 predicted, -2.7) |
| 2003.11 | 140.8 | 67.3 | (53.5 predicted, -2.7) |
| 2003.12 | 114.9 | 46.5 | (50.9 predicted, -2.6) |
| 2004.01 | 114.1 | 37.2 | (46.7 predicted, -4.2) |
| 2004.02 | 107.0 | 46.0 | (42.1 predicted, -4.6) |
| 2004.03 | 105.8 (1) | 38.4 (2) | (39.7 predicted, -2.4) |
1) Running average based on the daily 20:00 UTC observed solar flux value at 2800 MHz.
2) Unofficial, accumulated value based on the Boulder (NOAA/SEC) sunspot number. The official international sunspot number is typically
30-50% less.
This report has been prepared by Jan Alvestad. It is based partly on my own observations and analysis, and partly on data from some of these solar data sources. All time references are to the UTC day. Comments and suggestions are always welcome.
| [DX-Listeners' Club] |