
Last major update issued on June 24, 2004 at 03:30 UTC.
[Solar and geomagnetic data - last month (updated daily)]
[Solar wind and electron fluence charts (updated daily)]
[Solar cycles 21-23 (last update June 2, 2004)]
[Solar cycles 1-20]
[Graphical comparison of cycles 21, 22 and 23 (last update June 2, 2004)]
[Graphical comparison of cycles 2, 10, 13, 17, 20 and 23 (last update June 2, 2004)]
[Historical solar and geomagnetic data charts 1954-2004 (last update April 28,
2004)]
[Archived reports (last update June 21, 2004)]
The geomagnetic field was quiet to unsettled on June 23. Solar wind speed ranged between 298 and 347 km/sec.
Solar flux measured at 20h UTC on 2.8 GHz was 112.5. The planetary A
index was 5 (STAR Ap - based on the mean of three hour interval ap indices: 6.4).
Three hour interval K indices: 10112322 (planetary), 11112212 (Boulder).
The background x-ray flux is at the class B2-B3 level.
At midnight there were 4 spotted regions on the visible disk. The solar flare activity level was low. A total of 2 C class events was recorded during the day.
Region 10634 was quiet and stable.
Region 10635 was mostly unchanged and still has a magnetic delta structure in the trailing spot section. A minor M
class flare is possible. Flares: C1.2 at 03:01 and C2.5 at 06:05 UTC.
Region 10637 developed slowly and quietly.
Spotted regions not numbered by NOAA/SEC:
[S420] This region was split off from region 10635 on June 19 as magnetograms suggested that this is a bipolar region by
itself. The region decayed slightly on June 20 and then developed slowly on June 21-23. Location at midnight: S15W32.
June 21-23: No LASCO images available. Other image sources do not indicate any significant activity during the interval.
Coronal hole history (since late October 2002)
Compare today's report with the situation one solar rotation ago: 28
days ago 27 days ago 26 days ago
A recurrent trans equatorial coronal hole (CH103) will rotate into a geoeffective position on June 26-27.

Processed SOHO/EIT 284 image at 13:05 UTC on June 15. The darkest areas on the solar disk are likely coronal holes.
The geomagnetic field is expected to be mostly quiet on June 24 and quiet to unsettled on June 25-26.
| Coronal holes (1) | Coronal mass ejections (2) | M and X class flares (3) |
1) Effects from a coronal hole could reach Earth within the next 5 days. When the high speed stream has arrived
the color changes to green.
2) Material from a CME is likely to impact Earth within 96 hours.
3) There is a possibility of either M or X class flares within the next 48 hours.
Green: 0-20% probability, Yellow: 20-60% probability, Red: 60-100% probability.
Long distance low and medium frequency (below 2 MHz) propagation along east-west paths over high and upper middle latitudes is poor. Propagation along long distance north-south paths is fair to good. Trans Atlantic propagation conditions are monitored every night on 1470 kHz. Dominant stations tonight: Radio Cristal del Uruguay, Radio Vibraci�n (Venezuela) and Radio Rafaela (Argentina). On other frequencies stations from Brazil had improved signals compared to one day ago with the strongest stations noted on 740, 840, 930, 980, 1010, 1100, 1440 and 1600 kHz. 1510 WWZN Boston had a fair to good signal, while a few stations from Newfoundland and Nova Scotia could be heard on other frequencies.
Compare to the previous day's image.
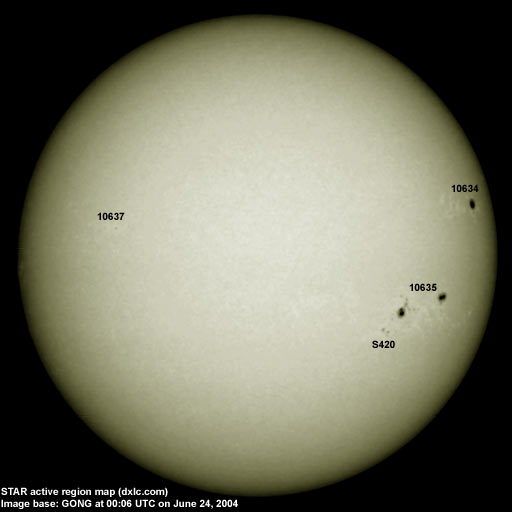
Data for all numbered solar regions according to the Solar Region Summary provided by NOAA/SEC. Comments are my own, as is the STAR spot count (spots observed at or inside a few hours before midnight) and data for regions not numbered by SEC or where SEC has observed no spots. SEC active region numbers in the table below and in the active region map above are the historic SEC/USAF numbers.
| Active region | Date numbered | SEC spot count |
STAR spot count |
Location at midnight | Area | Classification | Comment |
|---|---|---|---|---|---|---|---|
| 10634 | 2004.06.13 | 9 | 2 | N12W59 | 0150 | CKO |
classification was HSX at midnight, area 0220, location was N12W64 |
| 10635 | 2004.06.14 | 47 | 39 | S12W40 | 0470 | FHC |
beta-gamma-delta classification was FAI at midnight, location was S10W42 |
| 10636 | 2004.06.20 | 4 | S10W11 | 0010 | BXO | spotless | |
| 10637 | 2004.06.21 | 4 | 5 | N08E37 | 0010 | BXO |
classification was CSO at midnight, area 0030 |
| S420 | 2004.06.19 | 15 | S15W33 | 0050 | DSO | split off from 10635 | |
| S422 | 2004.06.20 | S10W21 | plage | ||||
| S423 | 2004.06.22 | S14W60 | plage | ||||
| Total spot count: | 64 | 61 | |||||
| SSN: | 104 | 101 | |||||
| Month | Average solar flux at Earth |
International sunspot number | Smoothed sunspot number |
|---|---|---|---|
| 2000.04 | 184.2 | 125.5 | 120.8 cycle 23 sunspot max. |
| 2000.07 | 202.3 | 170.1 | 119.8 |
| 2001.12 | 235.1 | 132.2 | 114.6 (-0.9) |
| 2003.05 | 115.7 | 55.2 | 67.6 (-2.5) |
| 2003.06 | 129.3 | 77.4 | 65.0 (-2.6) |
| 2003.07 | 127.7 | 83.3 | 61.8 (-3.2) |
| 2003.08 | 122.1 | 72.7 | 60.0 (-1.8) |
| 2003.09 | 112.2 | 48.7 | 59.5 (-0.5) |
| 2003.10 | 151.7 | 65.5 | 58.1 (-1.4) |
| 2003.11 | 140.8 | 67.3 | 56.7 (-1.4) |
| 2003.12 | 114.9 | 46.5 | (54.4 predicted, -2.3) |
| 2004.01 | 114.1 | 37.2 | (50.5 predicted, -3.9) |
| 2004.02 | 107.0 | 46.0 | (46.2 predicted, -4.3) |
| 2004.03 | 112.0 | 48.9 | (43.5 predicted, -2.7) |
| 2004.04 | 101.2 | 39.3 | (41.4 predicted, -2.1) |
| 2004.05 | 99.8 | 41.5 | (38.2 predicted, -3.2) |
| 2004.06 | 98.2 (1) | 62.8 (2) | (35.3 predicted, -2.9) |
1) Running average based on the daily 20:00 UTC observed solar flux value at 2800 MHz.
2) Unofficial, accumulated value based on the Boulder (NOAA/SEC) sunspot number. The official international sunspot number is typically
30-50% less.
This report has been prepared by Jan Alvestad. It is based partly on my own observations and analysis, and partly on data from some of these solar data sources. All time references are to the UTC day. Comments and suggestions are always welcome.
| [DX-Listeners' Club] |