
Last major update issued on June 22, 2004 at 03:45 UTC.
[Solar and geomagnetic data - last month (updated daily)]
[Solar wind and electron fluence charts (updated daily)]
[Solar cycles 21-23 (last update June 2, 2004)]
[Solar cycles 1-20]
[Graphical comparison of cycles 21, 22 and 23 (last update June 2, 2004)]
[Graphical comparison of cycles 2, 10, 13, 17, 20 and 23 (last update June 2, 2004)]
[Historical solar and geomagnetic data charts 1954-2004 (last update April 28,
2004)]
[Archived reports (last update June 21, 2004)]
The geomagnetic field was quiet on June 21. Solar wind speed ranged between 347 and 386 km/sec.
Solar flux measured at 20h UTC on 2.8 GHz was 115.8. The planetary A
index was 4 (STAR Ap - based on the mean of three hour interval ap indices: 5.3).
Three hour interval K indices: 12122111 (planetary), 11213112 (Boulder).
The background x-ray flux is at the class B2 level.
At midnight there were 6 spotted regions on the visible disk. The solar flare activity level was low. A total of 1 C class event was recorded during the day.
Region 10632 decayed slowly and rotated to the southwest limb.
Region 10634 decayed further losing all penumbra on the trailing spots. There is still a weak magnetic delta structure
in a small penumbra just south of the large leading penumbra. A minor M class flare is possible.
Region 10635 lost some small spots in the leading spot section. The magnetic delta structure in the largest trailing
penumbra is still there and could be the origin of an M class flare. developed slowly in the trailing spot section. There is a magnetic delta structure in the main trailing
penumbra. Flare: C2.0 at 17:16 UTC.
Region 10636 decayed slowly and quietly.
New region 10637 rotated into view at the northeast limb.
Spotted regions not numbered by NOAA/SEC:
[S420] This region was split off from region 10635 on June 19 as magnetograms suggested that this is a bipolar region by
itself. The region has many small spots. The region decayed slightly on June 20 and then developed slowly on June 21. Location at midnight:
S15W08.
June 19-21: No fully or partly Earth directed CMEs observed. No new LASCO images have become available since early on June 20, little or no new LASCO data is expected to become available until shortly before the end of June.
Coronal hole history (since late October 2002)
Compare today's report with the situation one solar rotation ago: 28
days ago 27 days ago 26 days ago
No obvious coronal holes are currently at or near geoeffective positions.

Processed SOHO/EIT 284 image at 13:05 UTC on June 15. The darkest areas on the solar disk are likely coronal holes.
The geomagnetic field is expected to be mostly quiet on June 22-24.
| Coronal holes (1) | Coronal mass ejections (2) | M and X class flares (3) |
1) Effects from a coronal hole could reach Earth within the next 5 days. When the high speed stream has arrived
the color changes to green.
2) Material from a CME is likely to impact Earth within 96 hours.
3) There is a possibility of either M or X class flares within the next 48 hours.
Green: 0-20% probability, Yellow: 20-60% probability, Red: 60-100% probability.
Long distance low and medium frequency (below 2 MHz) propagation along east-west paths over high and upper middle latitudes is poor to very poor. Propagation along long distance north-south paths is fair to good. Trans Atlantic propagation conditions are monitored every night on 1470 kHz. Dominant stations tonight: Radio Cristal del Uruguay early on (from 22:30 UTC onwards), then Radio Vibraci�n (Venezuela) with Union Radio Noticias programming after 01h UTC. 2 unidentified stations from Argentina were noted on the same frequency before 01h UTC. On other frequencies propagation was best towards Brazil, Argentina and Uruguay. For the second consecutive night R�dio Floresta (Brazil) on 1590 kHz had a good and stable signal, however, there was some interference from other stations. 1510 WWZN Boston was the only North American stations noted with a poor to fair signal.
Compare to the previous day's image.
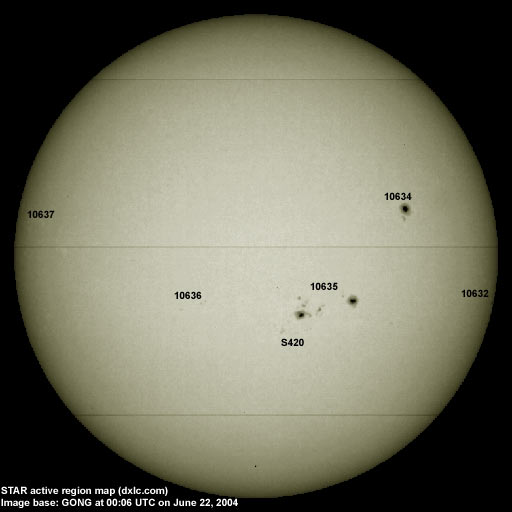
Data for all numbered solar regions according to the Solar Region Summary provided by NOAA/SEC. Comments are my own, as is the STAR spot count (spots observed at or inside a few hours before midnight) and data for regions not numbered by SEC or where SEC has observed no spots. SEC active region numbers in the table below and in the active region map above are the historic SEC/USAF numbers.
| Active region | Date numbered | SEC spot count |
STAR spot count |
Location at midnight | Area | Classification | Comment |
|---|---|---|---|---|---|---|---|
| 10632 | 2004.06.10 | 1 | 1 | S12W78 | 0050 | HSX |
area was 0030 at midnight |
| 10633 | 2004.06.13 | S08W67 | plage | ||||
| 10634 | 2004.06.13 | 14 | 9 | N12W31 | 0320 | FKO |
beta-gamma-delta classification was EKO at midnight, location was N12W34 |
| 10635 | 2004.06.14 | 64 | 32 | S12W14 | 0510 | FKC |
beta-gamma-delta classification was FKI at midnight, location was S10W16 |
| 10636 | 2004.06.20 | 9 | 7 | S10E17 | 0050 | DSO |
classification was CSO at midnight. area 0030 |
| 10637 | 2004.06.21 | 1 | 2 | N08E63 | 0000 | AXX | |
| S420 | 2004.06.19 | 15 | S15W07 | 0030 | CRI | split off from 10635 | |
| S422 | 2004.06.20 | S10E05 | plage | ||||
| Total spot count: | 89 | 66 | |||||
| SSN: | 139 | 126 | |||||
| Month | Average solar flux at Earth |
International sunspot number | Smoothed sunspot number |
|---|---|---|---|
| 2000.04 | 184.2 | 125.5 | 120.8 cycle 23 sunspot max. |
| 2000.07 | 202.3 | 170.1 | 119.8 |
| 2001.12 | 235.1 | 132.2 | 114.6 (-0.9) |
| 2003.05 | 115.7 | 55.2 | 67.6 (-2.5) |
| 2003.06 | 129.3 | 77.4 | 65.0 (-2.6) |
| 2003.07 | 127.7 | 83.3 | 61.8 (-3.2) |
| 2003.08 | 122.1 | 72.7 | 60.0 (-1.8) |
| 2003.09 | 112.2 | 48.7 | 59.5 (-0.5) |
| 2003.10 | 151.7 | 65.5 | 58.1 (-1.4) |
| 2003.11 | 140.8 | 67.3 | 56.7 (-1.4) |
| 2003.12 | 114.9 | 46.5 | (54.4 predicted, -2.3) |
| 2004.01 | 114.1 | 37.2 | (50.5 predicted, -3.9) |
| 2004.02 | 107.0 | 46.0 | (46.2 predicted, -4.3) |
| 2004.03 | 112.0 | 48.9 | (43.5 predicted, -2.7) |
| 2004.04 | 101.2 | 39.3 | (41.4 predicted, -2.1) |
| 2004.05 | 99.8 | 41.5 | (38.2 predicted, -3.2) |
| 2004.06 | 96.6 (1) | 55.6 (2) | (35.3 predicted, -2.9) |
1) Running average based on the daily 20:00 UTC observed solar flux value at 2800 MHz.
2) Unofficial, accumulated value based on the Boulder (NOAA/SEC) sunspot number. The official international sunspot number is typically
30-50% less.
This report has been prepared by Jan Alvestad. It is based partly on my own observations and analysis, and partly on data from some of these solar data sources. All time references are to the UTC day. Comments and suggestions are always welcome.
| [DX-Listeners' Club] |