
Last major update issued on June 16, 2004 at 03:50 UTC.
[Solar and geomagnetic data - last month (updated daily)]
[Solar wind and electron fluence charts (updated daily)]
[Solar cycles 21-23 (last update June 2, 2004)]
[Solar cycles 1-20]
[Graphical comparison of cycles 21, 22 and 23 (last update June 2, 2004)]
[Graphical comparison of cycles 2, 10, 13, 17, 20 and 23 (last update June 2, 2004)]
[Historical solar and geomagnetic data charts 1954-2004 (last update April 28,
2004)]
[Archived reports (last update June 14, 2004)]
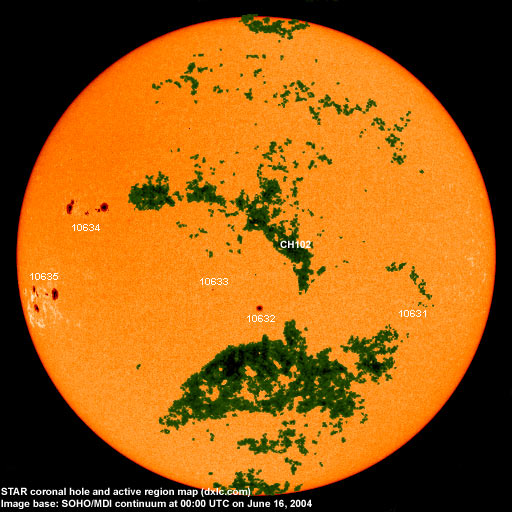
The geomagnetic field was quiet to minor storm on June 15. Solar wind speed ranged between 399 and 586 km/sec under the influence of a high speed stream from coronal hole CH101.
Solar flux measured at 20h UTC on 2.8 GHz was 109.4. The planetary A
index was 16 (STAR Ap - based on the mean of three hour interval ap indices: 16.8).
Three hour interval K indices: 21534333 (planetary), 32434432 (Boulder).
The background x-ray flux is at the class B2 level.
At midnight there were 5 spotted regions on the visible disk. The solar flare activity level was low. A total of 1 C class event was recorded during the day.
Region 10631 reemerged with a single spot.
Region 10632 was quiet and stable.
Region 10633 decayed and was spotless, then a single spot reemerged.
Region 10634 developed in the leading and central spot sections while the trailing penumbra split into two. The region
has mixed polarities and a minor M class flare is possible. Flare: C1.1 at 20:01 UTC.
Region 10635 was mostly unchanged in the spot layout. Unusually bright plage is still observed in the southern and central
parts of the region. Polarities are intermixed and a minor M class flare is possible.
June 13-15: No fully or partly Earth directed CMEs observed.
Coronal hole history (since late October 2002)
Compare today's report with the situation one solar rotation ago: 28
days ago 27 days ago 26 days ago
A recurrent coronal hole (CH101) in the southern hemisphere was in a geoeffective position on June 12. A recurrent trans equatorial coronal hole (CH102) was in a geoeffective position on June 14-15.

Processed SOHO/EIT 284 image at 13:05 UTC on June 15. The darkest areas on the solar disk are likely coronal holes.
The geomagnetic field is expected to be quiet to unsettled on June 16 and quiet to active on June 17-18 under the influence of a high speed stream from coronal hole CH102.
| Coronal holes (1) | Coronal mass ejections (2) | M and X class flares (3) |
1) Effects from a coronal hole could reach Earth within the next 5 days. When the high speed stream has arrived
the color changes to green.
2) Material from a CME is likely to impact Earth within 96 hours.
3) There is a possibility of either M or X class flares within the next 48 hours.
Green: 0-20% probability, Yellow: 20-60% probability, Red: 60-100% probability.
Long distance low and medium frequency (below 2 MHz) propagation along east-west paths over high and upper middle latitudes is very poor to useless. Propagation along long distance north-south paths is good to excellent. Trans Atlantic propagation conditions are monitored every night on 1470 kHz. Dominant station tonight: Radio Cristal del Uruguay. On other frequencies a number of stations from Brazil, Uruguay and Argentina were noted. Argentina was best on 710 (Radio Diez) and 790 (Radio Mitre) kHz while the best signals from Brazil were on 740, 930, 980, 1010 and 1440 kHz. Stations from Uruguay had an unusually good night with nice signals on 850, 1480, 1510, 1570 and 1580 kHz. Two stations were noted on 1520 kHz, one of them was Radio Chascom�s (Argentina), the other one had talk only and was probably from Uruguay. Propagation was best from local sunrise and over one hour afterwards. No North American stations were observed.
Compare to the previous day's image.
Data for all numbered solar regions according to the Solar Region Summary provided by NOAA/SEC. Comments are my own, as is the STAR spot count (spots observed at or inside a few hours before midnight) and data for regions not numbered by SEC or where SEC has observed no spots. SEC active region numbers in the table below and in the active region map above are the historic SEC/USAF numbers.
| Active region | Date numbered | SEC spot count |
STAR spot count |
Location at midnight | Area | Classification | Comment |
|---|---|---|---|---|---|---|---|
| 10628 | 2004.06.07 | S09W89 | plage | ||||
| 10629 | 2004.06.07 | S05W82 | plage | ||||
| 10630 | 2004.06.07 | N14W48 | plage | ||||
| 10631 | 2004.06.09 | 3 | 1 | S10W38 | 0010 | BXO |
classification was AXX at midnight |
| 10632 | 2004.06.10 | 1 | 1 | S12E00 | 0090 | HSX | |
| 10633 | 2004.06.13 | 1 | S06E11 | 0020 | HRX | ||
| 10634 | 2004.06.13 | 25 | 17 | N11E48 | 0370 | EKI |
beta-gamma classification was EAI at midnight |
| 10635 | 2004.06.14 | 18 | 17 | S10E65 | 0390 | FKI |
beta-gamma classification was FAI at midnight |
| Total spot count: | 47 | 37 | |||||
| SSN: | 87 | 87 | |||||
| Month | Average solar flux at Earth |
International sunspot number | Smoothed sunspot number |
|---|---|---|---|
| 2000.04 | 184.2 | 125.5 | 120.8 cycle 23 sunspot max. |
| 2000.07 | 202.3 | 170.1 | 119.8 |
| 2001.12 | 235.1 | 132.2 | 114.6 (-0.9) |
| 2003.05 | 115.7 | 55.2 | 67.6 (-2.5) |
| 2003.06 | 129.3 | 77.4 | 65.0 (-2.6) |
| 2003.07 | 127.7 | 83.3 | 61.8 (-3.2) |
| 2003.08 | 122.1 | 72.7 | 60.0 (-1.8) |
| 2003.09 | 112.2 | 48.7 | 59.5 (-0.5) |
| 2003.10 | 151.7 | 65.5 | 58.1 (-1.4) |
| 2003.11 | 140.8 | 67.3 | 56.7 (-1.4) |
| 2003.12 | 114.9 | 46.5 | (54.4 predicted, -2.3) |
| 2004.01 | 114.1 | 37.2 | (50.5 predicted, -3.9) |
| 2004.02 | 107.0 | 46.0 | (46.2 predicted, -4.3) |
| 2004.03 | 112.0 | 48.9 | (43.5 predicted, -2.7) |
| 2004.04 | 101.2 | 39.3 | (41.4 predicted, -2.1) |
| 2004.05 | 99.8 | 41.5 | (38.2 predicted, -3.2) |
| 2004.06 | 90.1 (1) | 32.0 (2) | (35.3 predicted, -2.9) |
1) Running average based on the daily 20:00 UTC observed solar flux value at 2800 MHz.
2) Unofficial, accumulated value based on the Boulder (NOAA/SEC) sunspot number. The official international sunspot number is typically
30-50% less.
This report has been prepared by Jan Alvestad. It is based partly on my own observations and analysis, and partly on data from some of these solar data sources. All time references are to the UTC day. Comments and suggestions are always welcome.
| [DX-Listeners' Club] |