
Last major update issued on June 14, 2004 at 03:30 UTC.
[Solar and geomagnetic data - last month (updated daily)]
[Solar wind and electron fluence charts (updated daily)]
[Solar cycles 21-23 (last update June 2, 2004)]
[Solar cycles 1-20]
[Graphical comparison of cycles 21, 22 and 23 (last update June 2, 2004)]
[Graphical comparison of cycles 2, 10, 13, 17, 20 and 23 (last update June 2, 2004)]
[Historical solar and geomagnetic data charts 1954-2004 (last update April 28,
2004)]
[Archived reports (last update June 7, 2004)]
The geomagnetic field was quiet on June 13. Solar wind speed ranged between 294 and 369 km/sec. A mild solar wind disturbance began at approximately 17h UTC. The interplanetary magnetic field was weakly to moderately southwards for the remainder of the day. While this disturbance was not reflected in the planetary A index, the main radio propagation direction became more southerly.
Solar flux measured at 20h UTC on 2.8 GHz was 95.2. The planetary A
index was 4 (STAR Ap - based on the mean of three hour interval ap indices: 5.1).
Three hour interval K indices: 10112222 (planetary), 21213323 (Boulder).
The background x-ray flux is at the class B3 level.
At midnight there were 4 spotted regions on the visible disk. The solar flare activity level was moderate. A total of 1 C and 1 M class events was recorded during the day.
Region 10632 was quiet and stable.
New region 10633 emerged in the southeast quadrant on June 12 and was numbered the next day by SEC. The region decayed
slowly on June 13 and could soon become spotless.
New region 10634 rotated partly into view at the northeast limb on June 12 and was numbered the next day by SEC. The region
has a magnetic delta structure in the trailing spot section and could produce further M class flares. Flares:
C4.1 at 04:44 and a long duration M1.0 event peaking at 11:56 UTC.
Spotted regions not numbered by NOAA/SEC:
[S418] This region rotated partly into view at the southeast limb late on June 13. The region has been displaying some
activity at the limb and could produce C flares. Location at midnight: S08E83.
June 11-13: No fully or partly Earth directed CMEs observed.
Coronal hole history (since late October 2002)
Compare today's report with the situation one solar rotation ago: 28
days ago 27 days ago 26 days ago
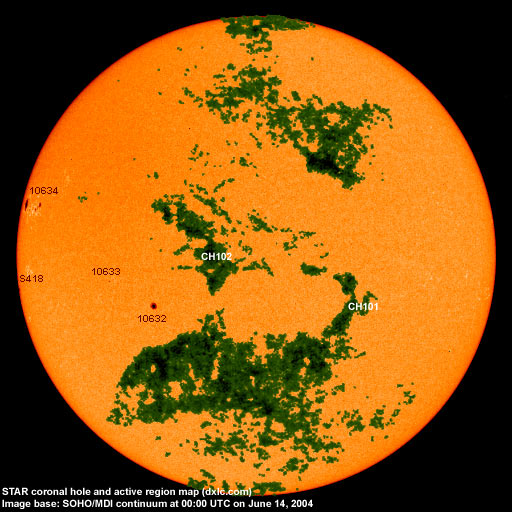
A recurrent coronal hole (CH101) in the southern hemisphere was in a geoeffective position on June 12. A recurrent trans equatorial coronal hole (CH102) will likely rotate into a geoeffective position on June 15.

Processed SOHO/EIT 284 image at 01:05 UTC on June 14. The darkest areas on the solar disk are likely coronal holes.
The geomagnetic field is expected to be quiet to unsettled most of June 14 becoming unsettled to active late in the day and on June 15 due to a high speed stream from coronal hole CH101. Quiet to unsettled is expected for June 16-17 with quiet to active likely on June 18 due to a high speed stream from coronal hole CH102.
| Coronal holes (1) | Coronal mass ejections (2) | M and X class flares (3) |
1) Effects from a coronal hole could reach Earth within the next 5 days. When the high speed stream has arrived
the color changes to green.
2) Material from a CME is likely to impact Earth within 96 hours.
3) There is a possibility of either M or X class flares within the next 48 hours.
Green: 0-20% probability, Yellow: 20-60% probability, Red: 60-100% probability.
Long distance low and medium frequency (below 2 MHz) propagation along east-west paths over high and upper middle latitudes is very poor. Propagation along long distance north-south paths is poor. Trans Atlantic propagation conditions are monitored every night on 1470 kHz. Dominant station tonight: Radio Cristal del Uruguay. Radio Vibraci�n (Venezuela) was observed at an after local sunrise. On other frequencies a few stations from Brazil (740, 980 and 1440 kHz) had fairly good signals. 1510 WWZN was the only station from North America with a weak signal at local sunrise.
Compare to the previous day's image.
Data for all numbered solar regions according to the Solar Region Summary provided by NOAA/SEC. Comments are my own, as is the STAR spot count (spots observed at or inside a few hours before midnight) and data for regions not numbered by SEC or where SEC has observed no spots. SEC active region numbers in the table below and in the active region map above are the historic SEC/USAF numbers.
| Active region | Date numbered | SEC spot count |
STAR spot count |
Location at midnight | Area | Classification | Comment |
|---|---|---|---|---|---|---|---|
| 10627 | 2004.06.05 | S09W74 | plage | ||||
| 10628 | 2004.06.07 | S09W63 | plage | ||||
| 10629 | 2004.06.07 | S05W56 | plage | ||||
| 10630 | 2004.06.07 | N14W22 | plage | ||||
| 10631 | 2004.06.09 | 5 | S10W10 | 0020 | CAO | spotless | |
| 10632 | 2004.06.10 | 1 | 1 | S11E26 | 0070 | HSX | |
| 10633 | 2004.06.13 | 2 | 1 | S05E37 | 0010 | AXX | formerly region S416 |
| 10634 | 2004.06.13 | 7 | 15 | N12E73 | 0120 | DAO |
beta-gamma-delta formerly region S417 classification was DAI at midnight, area 0300 |
| S414 | emerged on 2004.06.07 |
S03W64 | plage | ||||
| S418 | visible on 2004.06.13 |
1 | S08E83 | 0040 | HSX | ||
| Total spot count: | 15 | 18 | |||||
| SSN: | 55 | 58 | |||||
| Month | Average solar flux at Earth |
International sunspot number | Smoothed sunspot number |
|---|---|---|---|
| 2000.04 | 184.2 | 125.5 | 120.8 cycle 23 sunspot max. |
| 2000.07 | 202.3 | 170.1 | 119.8 |
| 2001.12 | 235.1 | 132.2 | 114.6 (-0.9) |
| 2003.05 | 115.7 | 55.2 | 67.6 (-2.5) |
| 2003.06 | 129.3 | 77.4 | 65.0 (-2.6) |
| 2003.07 | 127.7 | 83.3 | 61.8 (-3.2) |
| 2003.08 | 122.1 | 72.7 | 60.0 (-1.8) |
| 2003.09 | 112.2 | 48.7 | 59.5 (-0.5) |
| 2003.10 | 151.7 | 65.5 | 58.1 (-1.4) |
| 2003.11 | 140.8 | 67.3 | 56.7 (-1.4) |
| 2003.12 | 114.9 | 46.5 | (54.4 predicted, -2.3) |
| 2004.01 | 114.1 | 37.2 | (50.5 predicted, -3.9) |
| 2004.02 | 107.0 | 46.0 | (46.2 predicted, -4.3) |
| 2004.03 | 112.0 | 48.9 | (43.5 predicted, -2.7) |
| 2004.04 | 101.2 | 39.3 | (41.4 predicted, -2.1) |
| 2004.05 | 99.8 | 41.5 | (38.2 predicted, -3.2) |
| 2004.06 | 87.8 (1) | 26.5 (2) | (35.3 predicted, -2.9) |
1) Running average based on the daily 20:00 UTC observed solar flux value at 2800 MHz.
2) Unofficial, accumulated value based on the Boulder (NOAA/SEC) sunspot number. The official international sunspot number is typically
30-50% less.
This report has been prepared by Jan Alvestad. It is based partly on my own observations and analysis, and partly on data from some of these solar data sources. All time references are to the UTC day. Comments and suggestions are always welcome.
| [DX-Listeners' Club] |