
Last major update issued on July 3, 2004 at 04:40 UTC.
[Solar and geomagnetic data - last month (updated daily)]
[Solar wind and electron fluence charts (updated daily)]
[Solar cycles 21-23 (last update June 2, 2004)]
[Solar cycles 1-20]
[Graphical comparison of cycles 21, 22 and 23 (last update June 2, 2004)]
[Graphical comparison of cycles 2, 10, 13, 17, 20 and 23 (last update June 2, 2004)]
[Historical solar and geomagnetic data charts 1954-2004 (last update April 28,
2004)]
[Archived reports (last update July 1, 2004)]
The geomagnetic field was quiet to unsettled on July 2. Solar wind speed ranged between 466 and 559 km/sec under the slowly decreasing influence of a high speed stream from coronal hole CH103.
Solar flux measured at 20h UTC on 2.8 GHz was 80.7 (the lowest solar flux since the end of the last solar minimum). The planetary A
index was 9 (STAR Ap - based on the mean of three hour interval ap indices: 10.5).
Three hour interval K indices: 23223223 (planetary), 23222222 (Boulder).
The background x-ray flux is at the class A3 level.
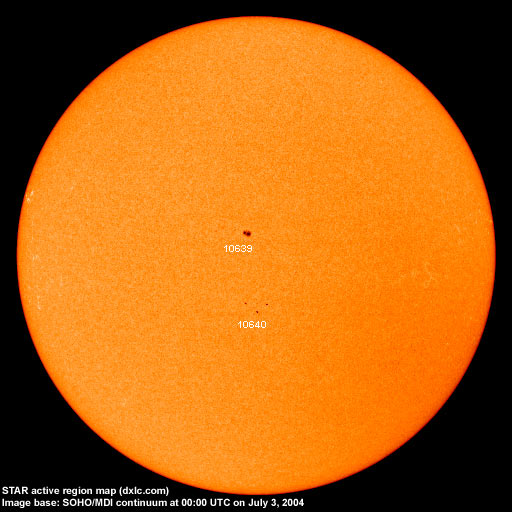
At midnight there were 2 spotted regions on the visible disk. The solar flare activity level was very low. No C class events were recorded during the day.
Region 10639 developed small trailing spots early in the day, then lost most of them after noon. The single penumbra
appears to be splitting into two penumbrae.
Region 10640 developed slowly as a negative polarity area emerged near the center of the weak positive leading polarity
area.
June 30-July 2: No obviously earth directed CMEs were detected.
Coronal hole history (since late October 2002)
Compare today's report with the situation one solar rotation ago: 28
days ago 27 days ago 26 days ago
No obvious coronal holes are currently approaching geoeffective positions.

Processed SOHO/EIT 284 image at 13:05 UTC on June 15. The darkest areas on the solar disk are likely coronal holes.
The geomagnetic field is expected to be quiet to unsettled on July 3-6.
| Coronal holes (1) | Coronal mass ejections (2) | M and X class flares (3) |
1) Effects from a coronal hole could reach Earth within the next 5 days. When the high speed stream has arrived
the color changes to green.
2) Material from a CME is likely to impact Earth within 96 hours.
3) There is a possibility of either M or X class flares within the next 48 hours.
Green: 0-20% probability, Yellow: 20-60% probability, Red: 60-100% probability.
Long distance low and medium frequency (below 2 MHz) propagation along east-west paths over high and upper middle latitudes is poor. Propagation along long distance north-south paths is good. Trans Atlantic propagation conditions are monitored every night on 1470 kHz. Dominant stations tonight: Radio Vibraci�n (Venezuela) and Radio Cristal del Uruguay. After local sunrise propagation favored Argentina and Uruguay with a number of interesting stations noted on frequencies like 1480 (2 stations), 1500, 1510, 1520, 1570 and 1580 kHz. WWZN Boston on 1510 kHz had a fair signal at times.
Compare to the previous day's image.
Data for all numbered solar regions according to the Solar Region Summary provided by NOAA/SEC. Comments are my own, as is the STAR spot count (spots observed at or inside a few hours before midnight) and data for regions not numbered by SEC or where SEC has observed no spots. SEC active region numbers in the table below and in the active region map above are the historic SEC/USAF numbers.
| Active region | Date numbered | SEC spot count |
STAR spot count |
Location at midnight | Area | Classification | Comment |
|---|---|---|---|---|---|---|---|
| 10637 | 2004.06.21 | N08W84 | plage | ||||
| 10638 | 2004.06.26 | N07W56 | plage | ||||
| 10639 | 2004.06.27 | 8 | 4 | N09E06 | 0090 | CAO | |
| 10640 | 2004.06.27 | 5 | 5 | S09E02 | 0020 | DSO | |
| Total spot count: | 13 | 9 | |||||
| SSN: | 33 | 29 | |||||
| Month | Average solar flux at Earth |
International sunspot number | Smoothed sunspot number |
|---|---|---|---|
| 2000.04 | 184.2 | 125.5 | 120.8 cycle 23 sunspot max. |
| 2000.07 | 202.3 | 170.1 | 119.8 |
| 2001.12 | 235.1 | 132.2 | 114.6 (-0.9) |
| 2003.05 | 115.7 | 55.2 | 67.6 (-2.5) |
| 2003.06 | 129.3 | 77.4 | 65.0 (-2.6) |
| 2003.07 | 127.7 | 83.3 | 61.8 (-3.2) |
| 2003.08 | 122.1 | 72.7 | 60.1 (-1.7) |
| 2003.09 | 112.2 | 48.7 | 59.6 (-0.5) |
| 2003.10 | 151.7 | 65.5 | 58.2 (-1.4) |
| 2003.11 | 140.8 | 67.3 | 56.8 (-1.4) |
| 2003.12 | 114.9 | 46.5 | 54.8 (-2.0) |
| 2004.01 | 114.1 | 37.7 | (51.1 predicted, -3.7) |
| 2004.02 | 107.0 | 45.8 | (46.9 predicted, -4.2) |
| 2004.03 | 112.0 | 49.1 | (44.1 predicted, -2.8) |
| 2004.04 | 101.2 | 39.3 | (42.1 predicted, -2.0) |
| 2004.05 | 99.8 | 41.5 | (38.8 predicted, -3.3) |
| 2004.06 | 97.4 | 43.2 | (36.0 predicted, -2.8) |
| 2004.07 | 81.0 (1) | 1.9 (2) | (34.2 predicted, -1.8) |
1) Running average based on the daily 20:00 UTC observed solar flux value at 2800 MHz.
2) Unofficial, accumulated value based on the Boulder (NOAA/SEC) sunspot number. The official international sunspot number is typically
30-50% less.
This report has been prepared by Jan Alvestad. It is based partly on my own observations and analysis, and partly on data from some of these solar data sources. All time references are to the UTC day. Comments and suggestions are always welcome.
| [DX-Listeners' Club] |