
Last major update issued on January 30, 2004 at 04:10 UTC.
[Solar and geomagnetic data - last month (updated daily)]
[Solar wind and electron fluence charts (updated daily)]
[Solar cycles 21-23 (last update January 4, 2004)]
[Solar cycles 1-20]
[Graphical comparison of cycles 21, 22 and 23 (last update January 4, 2004)]
[Graphical comparison of cycles 2, 10, 13, 17, 20 and 23 (last update January
4, 2004)]
[Historical solar and geomagnetic data charts 1954-2003 (last update January 16,
2004)]
[Archived reports (last update January 27, 2004)]
The geomagnetic field was quiet to active on January 29. Solar wind speed ranged between 401 and 571 km/sec. While solar wind speed decreased slowly all day, solar wind density increased slowly. The total field of the interplanetary magnetic field became stronger as well, particularly towards the end of the day and early on January 30. The IMF was moderately southwards 09-12h UTC, then swung northwards for a few hours. After 15h UTC increasingly stronger southward excursions of the IMF has been observed. Solar wind density and IMF total field development hints at the presence of a coronal hole flow, however, solar wind temperature and speed data do not currently support this. (Latest data: At 03:50 UTC on January 30 a significant increase in solar wind speed was observed at ACE and the probability that the solar wind is under the influence of a high speed stream is increasing. Perhaps the high speed stream from coronal hole CH78 is arriving earlier than expected?)
Solar flux measured at 20h UTC on 2.8 GHz was 87.4. The planetary A
index was 10 (STAR Ap - based on the mean of three hour interval ap indices: 12.1).
Three hour interval K indices: 12244322 (planetary), 12142212 (Boulder).
The background x-ray flux is at the class B2 level.
At midnight there were 3 spotted regions on the visible disk. Solar flare activity was very low.
New region 10545 emerged first on January 25, was spotless the next day, reemerged on January 27, became spotless again
on January 28 then developed quickly early on January 29. The region is simply structured and is exhibiting signs of decay again.
New region 10546 rotated into view on January 28 at the southeast limb.
Spotted regions not numbered by NOAA/SEC:
[S340] This region emerged slowly in the southeast quadrant on January 29. The layout of the positive and negative polarity
fields is interesting and the region could soon become more complex. Location at midnight: S09E26.
There is a fairly bright region at the northeast limb, this region should rotate into view today.
January 27-29: No partly or fully earth directed CME observed.
Coronal hole history (since late October 2002)
Compare today's report with the situation one solar rotation ago: 28
days ago 27 days ago 26 days ago
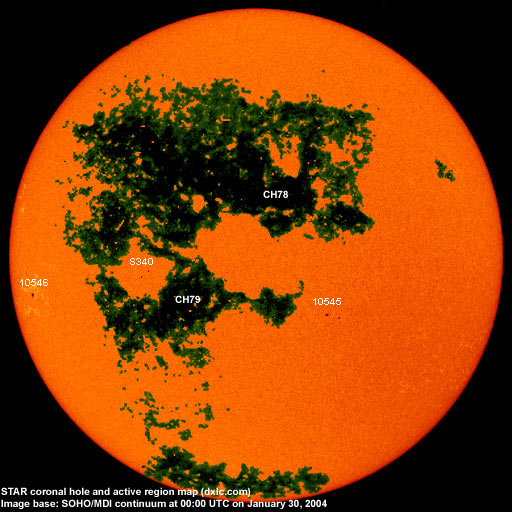
A recurrent coronal hole (CH78) in the northern hemisphere will rotate into a geoeffective position on January 28 - February 2. Another coronal hole (CH79) in the southern hemisphere is the southern part of what was coronal hole CH74 during the previous rotation.

Processed SOHO/EIT 284 image at 01:06 UTC on January 30. The darkest areas on the solar disk are likely coronal holes.
The geomagnetic field is expected to be quiet to minor storm on January 30 and unsettled to minor storm on January 31-February 5 under the influence of high speed streams from coronal holes CH78 and CH79. Occasional major storm intervals are possible.
Long distance low frequency (below 2 MHz) propagation along east-west paths over high and upper middle latitudes is very poor. Propagation along long distance north-south paths is poor. [Trans Atlantic propagation conditions are currently monitored every night on 1470 kHz. Dominant station tonight: Radio Cristal del Uruguay with a fair signal, occasionally Radio Rafaela (Argentina) was noted. Only a few other (weak) TA signals observed.]
| Coronal holes (1) | Coronal mass ejections (2) | M and X class flares (3) |
1) Effects from a coronal hole could reach Earth within the next 5 days. When the high speed stream has arrived
the color changes to green.
2) Material from a CME is likely to impact Earth within 96 hours.
3) There is a possibility of either M or X class flares within the next 48 hours.
Green: 0-20% probability, Yellow: 20-60% probability, Red: 60-100% probability.
Compare to the previous day's image.
Data for all numbered solar regions according to the Solar Region Summary provided by NOAA/SEC. Comments are my own, as is the STAR spot count (spots observed at or inside a few hours before midnight) and data for regions not numbered by SEC or where SEC has observed no spots. SEC active region numbers in the table below and in the active region map above are the historic SEC/USAF numbers.
| Active region | Date numbered | SEC spot count |
STAR spot count |
Location at midnight | Area | Classification | Comment |
|---|---|---|---|---|---|---|---|
| 10545 | 2004.01.29 | 4 | 5 | S20W19 | 0020 | DSO |
formerly region S335 location was S19W19 at midnight |
| 10546 | 2004.01.29 | 1 | 3 | S12E68 | 0050 | HSX |
formerly region S339 location was S12E66 at midnight, classification CSO |
| S336 | emerged on 2004.01.26 |
N12W31 | plage | ||||
| S337 | emerged on 2004.01.26 |
S04E05 | plage | ||||
| S338 | emerged on 2004.01.27 |
N16W08 | plage | ||||
| S340 | emerged on 2004.01.29 |
4 | S09E26 | 0020 | DRO | ||
| Total spot count: | 5 | 12 | |||||
| SSN: | 25 | 42 | |||||
| Month | Average solar flux at Earth |
International sunspot number | Smoothed sunspot number |
|---|---|---|---|
| 2000.04 | 184.2 | 125.5 | 120.8 cycle 23 sunspot max. |
| 2000.07 | 202.3 | 170.1 | 119.8 |
| 2001.12 | 235.1 | 132.2 | 114.6 (-0.9) |
| 2002.12 | 157.2 | 80.8 | 82.0 (-3.2) |
| 2003.01 | 144.0 | 79.7 | 80.8 (-1.2) |
| 2003.02 | 124.5 | 46.0 | 78.3 (-2.5) |
| 2003.03 | 131.4 | 61.1 | 74.0 (-4.3) |
| 2003.04 | 126.4 | 60.0 | 70.1 (-3.9) |
| 2003.05 | 115.7 | 55.2 | 67.6 (-2.5) |
| 2003.06 | 129.3 | 77.4 | 65.0 (-2.6) |
| 2003.07 | 127.7 | 83.3 | (62.0 predicted, -3.0) |
| 2003.08 | 122.1 | 72.7 | (59.4 predicted, -2.6) |
| 2003.09 | 112.2 | 48.7 | (57.5 predicted, -1.9) |
| 2003.10 | 151.7 | 65.6 | (54.7 predicted, -2.8) |
| 2003.11 | 140.8 | 67.2 | (52.0 predicted, -2.7) |
| 2003.12 | 114.9 | 47.0 | (49.4 predicted, -2.6) |
| 2004.01 | 115.5 (1) | 58.4 (2) | (45.3 predicted, -4.1) |
1) Running average based on the daily 20:00 UTC observed solar flux value at 2800 MHz.
2) Unofficial, accumulated value based on the Boulder (NOAA/SEC) sunspot number. The official international sunspot number is typically
30-50% less.
This report has been prepared by Jan Alvestad. It is based partly on my own observations and analysis, and partly on data from sources noted in solar links. All time references are to the UTC day. Comments and suggestions are always welcome.
| [DX-Listeners' Club] |