
Last major update issued on January 21, 2004 at 04:45 UTC. Minor update posted at 14:08 UTC. The next major update will be posted on January 26 as I will be on a short vacation.
[Solar and geomagnetic data - last month (updated daily)]
[Solar wind and electron fluence charts (updated daily)]
[Solar cycles 21-23 (last update January 4, 2004)]
[Solar cycles 1-20]
[Graphical comparison of cycles 21, 22 and 23 (last update January 4, 2004)]
[Graphical comparison of cycles 2, 10, 13, 17, 20 and 23 (last update January
4, 2004)]
[Historical solar and geomagnetic data charts 1954-2003 (last update January 16,
2004)]
[Archived reports (last update January 19, 2004)]
The geomagnetic field was quiet to active on January 20. Solar wind speed ranged between 477 and 590 km/sec under the influence of a high speed stream from coronal hole CH76. The high speed stream ended late in the day.
Solar flux measured at 20h UTC on 2.8 GHz was 128.9. The planetary A
index was 16 (STAR Ap - based on the mean of three hour interval ap indices: 16.6).
Three hour interval K indices: 33324433 (planetary), 33334423 (Boulder).
The background x-ray flux is at the class B3 level.
At midnight there were 4 spotted regions on the visible disk. Solar flare activity was high. A total of 1 C and 1 M class events was recorded during the day.
Region 10540 decayed, both in the leading and trailing spot sections. Another M class flare may be possible. Flare:
M6.1/2N (associated with a strong type II radio sweep) at 07:43 UTC.
Region 10542 developed slowly and quietly. There is some polarity intermixing and C flares are possible.
Region 10543 was mostly unchanged and quiet.
New region 10544 emerged quickly in the northeast quadrant on January 18 and was numbered by SEC two days later. Flare:
C1.8 at 05:12 UTC.
A filament eruption in the southeast quadrant began before 04h UTC on January 21 and may be associated with a partly earth directed CME. If that is the case I will issue an update later today.
Comment added at 10:14 UTC on January 21: The filament eruption mentioned above was large and has caused at least a partial halo CME with most of the ejected material seen off of the southeast limb. Parts of this fairly slow CME may be heading towards Earth and could reach us on January 24.
Comment added at 14:08 UTC: There is still activity in the area in the southeast quadrant affected by the filament eruption. Although faint in the northwest the CME is a full halo.
January 19-20: The long duration C5.7 event in region 10540 late on January 19 and early on January 20 was associated with a full halo CME. The CME will likely impact Earth sometime between 20h UTC on January 21 and noon on January 22.
January 18: The M1 flare in region 10540 early in the day was associated with a partial halo CME observed mostly off of the southern limbs and the south pole. It is uncertain if there are any earth directed parts of this CME.
Coronal hole history (since late October 2002)
Compare today's report with the situation one solar rotation ago: 28
days ago 27 days ago 26 days ago
A recurrent trans equatorial coronal hole (CH77) will rotate into a geoeffective position on January 24-25.
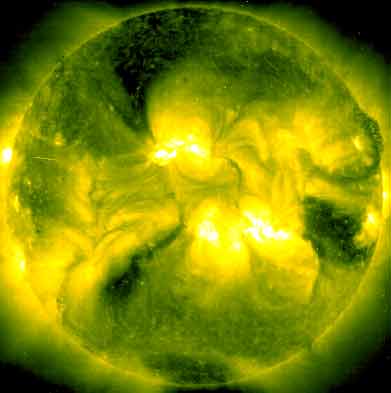
Processed SOHO/EIT 284 image at 19:06 UTC on January 20. The darkest areas on the solar disk are likely coronal holes.
The geomagnetic field is expected to be quiet to unsettled on January 21 and active to major storm on January 22 when a CME is expected to impact Earth. Mostly quiet to unsettled is expected for January 23-26.
Long distance low frequency (below 2 MHz) propagation along east-west paths over high and upper middle latitudes is poor. Propagation along long distance north-south paths is poor to very poor. [Trans Atlantic propagation conditions are currently monitored every night on 1470 kHz. Dominant station tonight: Radio Vibraci�n (Venezuela) with a weak signal almost buried in noise. On the northwesterly EWE several of the usual Newfoundland and Nova Scotia stations could be heard].
| Coronal holes (1) | Coronal mass ejections (2) | M and X class flares (3) |
1) Effects from a coronal hole could reach Earth within the next 5 days. When the high speed stream has arrived
the color changes to green.
2) Material from a CME is likely to impact Earth within 96 hours.
3) There is a possibility of either M or X class flares within the next 48 hours.
Green: 0-20% probability, Yellow: 20-60% probability, Red: 60-100% probability.

Compare to the previous day's image.
Data for all numbered solar regions according to the Solar Region Summary provided by NOAA/SEC. Comments are my own, as is the STAR spot count (spots observed at or inside a few hours before midnight) and data for regions not numbered by SEC or where SEC has observed no spots. SEC active region numbers in the table below and in the active region map above are the historic SEC/USAF numbers.
| Active region | Date numbered | SEC spot count |
STAR spot count |
Location at midnight | Area | Classification | Comment |
|---|---|---|---|---|---|---|---|
| 10540 | 2004.01.12 | 23 | 13 | S14W22 | 0220 | EAO |
beta-gamma classification was ESO at midnight |
| 10541 | 2004.01.15 | S09W71 | plage | ||||
| 10542 | 2004.01.16 | 12 | 10 | N10W03 | 0110 | DAI | beta-gamma |
| 10543 | 2004.01.19 | 5 | 6 | S17W08 | 0080 | DAO | |
| 10544 | 2004.01.20 | 14 | 16 | N08E09 | 0130 | DAI |
beta-gamma formerly region S333 |
| S334 | emerged on 2004.01.18 |
S12W39 | plage | ||||
| Total spot count: | 54 | 45 | |||||
| SSN: | 94 | 85 | |||||
| Month | Average solar flux at Earth |
International sunspot number | Smoothed sunspot number |
|---|---|---|---|
| 2000.04 | 184.2 | 125.5 | 120.8 cycle 23 sunspot max. |
| 2000.07 | 202.3 | 170.1 | 119.8 |
| 2001.12 | 235.1 | 132.2 | 114.6 (-0.9) |
| 2002.12 | 157.2 | 80.8 | 82.0 (-3.2) |
| 2003.01 | 144.0 | 79.7 | 80.8 (-1.2) |
| 2003.02 | 124.5 | 46.0 | 78.3 (-2.5) |
| 2003.03 | 131.4 | 61.1 | 74.0 (-4.3) |
| 2003.04 | 126.4 | 60.0 | 70.1 (-3.9) |
| 2003.05 | 115.7 | 55.2 | 67.6 (-2.5) |
| 2003.06 | 129.3 | 77.4 | 65.0 (-2.6) |
| 2003.07 | 127.7 | 83.3 | (62.0 predicted, -3.0) |
| 2003.08 | 122.1 | 72.7 | (59.4 predicted, -2.6) |
| 2003.09 | 112.2 | 48.7 | (57.5 predicted, -1.9) |
| 2003.10 | 151.7 | 65.6 | (54.7 predicted, -2.8) |
| 2003.11 | 140.8 | 67.2 | (52.0 predicted, -2.7) |
| 2003.12 | 114.9 | 47.0 | (49.4 predicted, -2.6) |
| 2004.01 | 120.3 (1) | 45.5 (2) | (45.3 predicted, -4.1) |
1) Running average based on the daily 20:00 UTC observed solar flux value at 2800 MHz.
2) Unofficial, accumulated value based on the Boulder (NOAA/SEC) sunspot number. The official international sunspot number is typically
30-50% less.
This report has been prepared by Jan Alvestad. It is based partly on my own observations and analysis, and partly on data from sources noted in solar links. All time references are to the UTC day. Comments and suggestions are always welcome.
| [DX-Listeners' Club] |